The Likelihood of ‘Like’: The Frequency of Discourse Markers Used by Gen Z Influencers in Different Tik Tok Video Contexts

Hayden Hansel, Paige Runyan, Carla Bueno, Tallulah Blinn, Erin Marshall

The universally understood verbal pause, “uh” can be implemented across hundreds of languages. As a constant aspect in communication, discourse markers, also known as filler words, (these two terms will be used interchangeably) are words such as uh, umm, and like which act as pauses in speech to process thoughts. With the rise of casual and conversational styled online media, “uh” (and other markers) are heard now more than ever. We looked at five different Generation Z Influencers to see if different contexts of videos have different frequencies of discourse markers. This posed the question: which type of discourse marker has the highest frequency of use, and is there an association with the number of cuts in a Tik Tok video and the frequency of filler words? We found that there is an association between more informal videos and a higher number of discourse markers in our data set. The most frequent filler word used was the word ‘like,’ and in advertisement videos, we observed a trend of more frequent edits and a lower use of filler words[1].

[expander_maker id=”1″ more=”Read more” less=”Read less”]

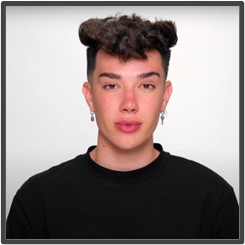
Image 1. Spencer Barbosa’s most recent vlog thumbnail showcases her approachable and relatable lifestyle content, reflecting the personal branding style typical of her online presence.

Image 2: TikTok app listing on the Apple App store with logo.

Introduction and Background

TikTok is a social media platform launched in 2016, becoming a globally popular app where users create and watch 5-second to 10-minute-long videos. TikTok uses an algorithm to curate a personalized feed of videos for each user on a “For You Page,” which distributes content. The algorithm prioritizes content of popular creators, leading to a rise in influencers who contribute to trends on the app. The video content varies greatly with marketing, influencing, political activism, comedy, and much more, attracting a wide range of audiences. In the U.S., TikTok has over 30.8 million active users daily, with kids averaging 75 minutes on the app daily (D’Souza, 2025). Demographically, 36.7% of its users are aged 18 to 24, and 52% are female. Notably, 60% of the influencers on TikTok are Gen Z age (Magnet, 2025). With Gen Z having a dominant influencer presence on the platform and females being the primary gender, we wanted to specifically observe Gen Z female influencers, looking at their language use.

Our study focuses on discourse markers, also known as filler words such as ‘um,’ ‘uh,’ and ‘like.’ ‘Um’ was added to the Oxford English Dictionary in 1672, but people used these pauses in speech long before by people of all ages, races, and backgrounds. (Thompson, 2021) (Keyes, 2017). Filler words originated as a pause for speakers to collect their thoughts but have evolved into a common habit in everyday speech. Psychologist Robert Ecklund estimates that up to six percent of our words act as “verbal punctuation” rather than conveying meaning, suggesting seemingly meaningless filler words serve great purpose in communication. With the rise of casual online conversations, like on TikTok, discourse markers can be more prevalently observed in our mainstream media.

Curious about the overall evolving use of filler words and Generation Z influencer’s dominance on TikTok, we examined the frequency at which Gen Z influencers on TikTok use filler words, specifically within different contexts of videos. We targeted Gen Z female TikTok influencers, ages 13-28, with over two million followers. We produced the following hypotheses:

  1. Influencers who produce “informal” content like “get ready with me” and “storytime” videos will have a higher frequency of filler words as opposed to advertisements, which are often formally scripted or influenced by a brand that sponsors the video.
  2. There will be a negative correlation between the number of cuts and the number of filler words used in a video, suggesting that editing in videos reduces the number of filler words[2].

Methods

The methodological approach to this project accounted for the TikTok algorithm and stylistic differences. We started a new Tiktok account for the five of us to view the specific content we were observing in order to avoid our own individually curated algorithms. Each member of our group selected an influencer with over two million followers to research. The five we focused on were: Britany Broski, Spencer Barbosa, Alix Earle, Katie Fang, and Lexi Hidalgo. We recorded data for one vlog video, one get ready with me video, one advertisement video, one beauty or makeup related video, and one storytime video for each influencer. We logged the influencer’s general description such as their name, username, age, and follower count. For each video we recorded the title, the view count, the length, the number of cuts and a count for each of the following discourse markers: like, um, uh, well, you know, I mean, basically, actually, literally, and “other”. We recorded the total number of discourse markers used per video, and the corresponding rate of discourse markers per minute. We analyzed 25 Tik Tok videos comprising 45 minutes of content. From here, we created graphs to further interpret and compare our collected data.

Results and Analysis

We observed the highest counts of filler words in the casual conversational videos. Get Ready With Me (grwm) videos had the highest average of filler words (15.8/video) and beauty/makeup videos had the second highest average (12.6/video). The category with the lowest average number of filler words across all influencers was the advertisement category (5.2/video).

Figure 1- Total Number of Filler Words Per Influencer in Each Category of Video. The graph shows the total number of filler words recorded for each individual influencerin each Tik Tok video category with beauty/makeup and get ready with me being the highest
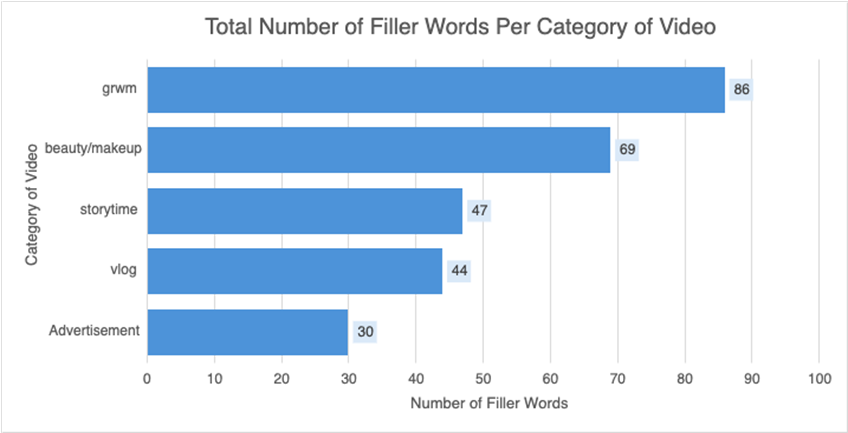
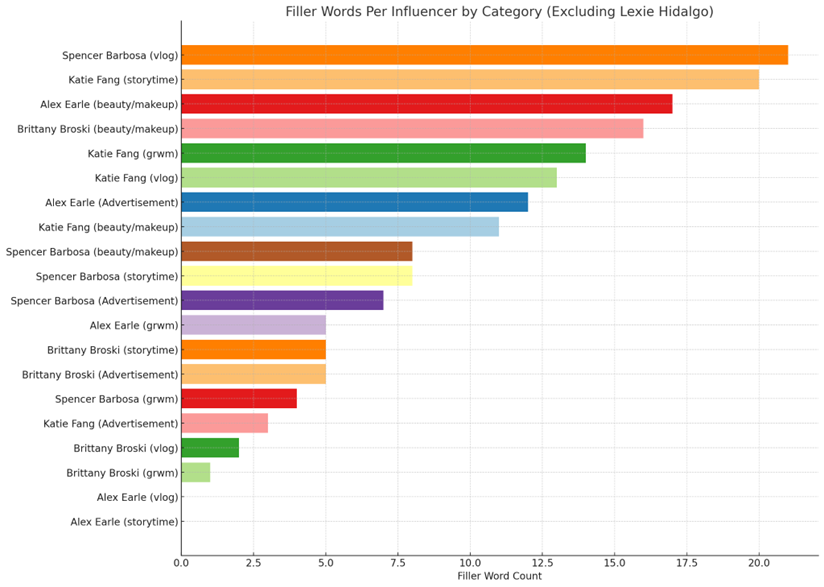
We noticed that Lexi Hidalgo had significantly more filler words than the other influencers in the dataset. To account for this, we looked at the results without her data and saw that the get ready with me still had the highest average number of filler words (17.25/video), meaning this type of video likely lends itself to more filler words in general. Without Lexi Hidalgo’s data, the lowest average number of filler words was also the advertisement category. We still see a pattern with beauty/makeup videos having the highest frequency of filler words and advertisements having the lowest frequency, even after accounting for our outlier.

Figure 2- Total Number of Filler Words Per Influencer in Each Category of Video (Without Lexi Hidalgo). This figure shows the total number of filler words for each category without Lexi Hidalgo’s data. The grwm category still has the highest average number of filler words.
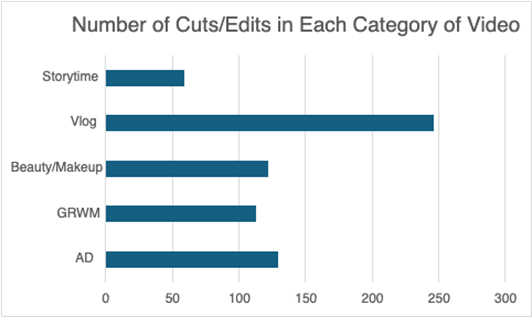
In addition, we observed the number of edits in each Tik Tok category. We hypothesized that more formal video contexts, such as advertisement videos, will have less filler words and more edits, because advertisements can be edited to communicate a branded message. We found that vlogs had the most edits, with a sum of 247 edits, and ads had the second highest with 130 edits. The category with the lowest number of edits was the storytime category, with 59 edits. This data supports our claim that videos can be intentionally edited to present an individual in a certain way. We see a trend with advertisement videos having the lowest average filler words recorded and the highest number of total edits in our data set.

Figure 3- Number of Cuts/Edits in Each Category of Video.  The figure shows the total number of cuts/edits in the TikTok videos per category. We see that Vlogs had the highest total number of edits and ADs had the second highest.
While we see an association that influencers can edit videos to present themselves in a certain way, it is important to note the stylistic choices online creators can make. Despite the trend that advertisements have fewer filler words, influencers may intentionally choose to leave fillers as part of a stylistic package or preference. Also, we see that certain influencers have preferences in the words they use. For example, Brittany Broski had the highest recorded number of ‘uh/uhh’ across all of her videos in comparison to the other influencers[3].

Figure 4- Total Number of Cuts/Edits in Each Video by Influencer.  The figure shows the total number of cuts/edits in the TikTok videos per influencer. We see that Lexi Hidalgo had the highest total number of edits
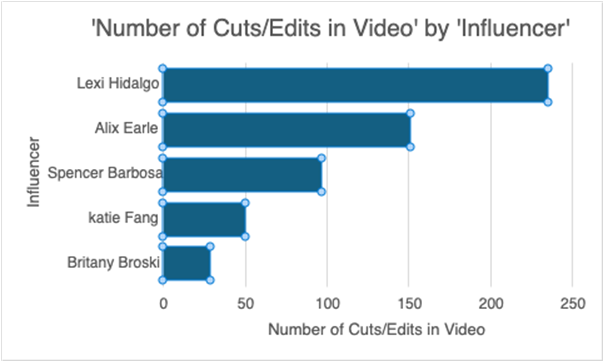
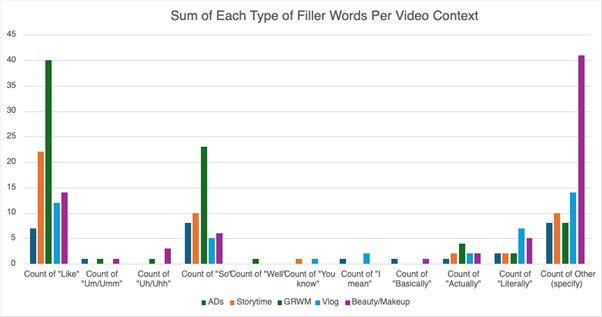
Figure 5- Sum of Each Type of Filler Words Per Video Context.  The figure shows the frequency of each type of filler word in each category of video. We see that ‘like’ and ‘so’ had the highest counts in our data.
Discussion and Conclusion

One of the main patterns we saw in our data was that filler words were used much more in informal video types, especially in beauty and makeup videos and vlogs. These are the kinds of videos where influencers are speaking casually, often unscripted, and trying to connect with their audience in a more personal way. The most commonly used filler words were “like” and “so,” which help speakers sound more relaxed and relatable. Although we can’t say that informal video formats directly cause more filler word usage, we did see a strong association between the two. It’s also clear that each influencer brings their own style to the table. For example, Lexi Hidalgo had both the highest number of filler words and the highest number of video cuts; 235 in total. This suggests her fast, edited format and casual speech are part of a “stylistic package” that makes her content feel personable and conversational. On the other hand, Britany Broski didn’t edit her videos as heavily but used the filler “uh” more than any of the other influencers we studied. This shows that filler word use also varies by individual speaking style, not just the video type. Some influencers rely more on certain speech habits, and editing choices also shape how many fillers we hear. Factors like editing, video length, or whether the video is a voiceover versus real-time can all affect filler word counts. Just because an ad has fewer fillers doesn’t mean it’s because it’s an ad, it may also be more scripted or professionally edited. For future research, we could analyze how video length or editing impacts filler word use, and look at whether these words influence audience engagement; do more fillers make someone seem more relatable, and does that boost likes or comments?

References

Abrahams, M. (2021, April 23). “um, like, so”: How filler words can be effective in communication. Stanford Graduate School of Business. https://www.gsb.stanford.edu/insights/um-so-how-filler-words-can-be-effective-commucation

Barbosa, Spencer. (2024). “DAY IN MY LIFE (getting my new house & pilates)” [YouTube thumbnail photo]. Youtube. https://youtu.be/8KelCzKvt3w?feature=shared.

Bestvater, S. (2024a, February 22). How U.S. adults use TikTok. Pew Research Center. https://www.pewresearch.org/internet/2024/02/22/how-u-s-adults-use-tiktok/

Bosker, H. R., Badaya, E., & Corley, M. (2021). Discourse Markers Activate Their, Like, Cohort Competitors. Discourse Processes, 58(9), 837–851. https://doi.org/10.1080/0163853X.2021.1924000.

D’Souza, D. (2022, June 22). What is TikTok? Investopedia. https://www.investopedia.com/what-is-tiktok-4588933

Duvall , E., Robbins, A., Graham, T., & Divett, S. (n.d.). Exploring Filler Words and Their Impact- BYU. https://schwa.byu.edu/. https://schwa.byu.edu/files/2014/12/F2014-Front.pdf.

Erard, M. (2015, September 1). Pause fillers. The American Scholar. https://theamericanscholar.org/pause-fillers/The American Scholar

Lanzarotti, V. (2017, October). What does saying “like” say about you. YouTube. https://youtu.be/IstIqrAyS2I

Magnet ABA. (2024, December 31). TikTok statistics, facts & user demographics. https://www.magnetaba.com/blog/tiktok-statistics-facts-user-demographics

Muliadi, B. (2024, August 12). What the rise of TikTok says about generation Z. Forbes. https://www.forbes.com/councils/forbestechcouncil/2020/07/07/what-the-rise-of-tiktok-says-about-generation-z/.

Munaro, A., Barcelos, R., Maffezzolli, E., Rodrigues, J., & Paraiso, E. (2024, March 28). Does your style engage? Linguistic styles of influencers and digital consumer engagement on YouTube. Does your style engage? Linguistic styles of influencers and digital consumer engagement on Youtube. https://www.sciencedirect.com/science/article/pii/S0747563224000852

musical.ly Inc. (n.d.). TikTok [Mobile app]. Amazon. Retrieved June 6, 2025, from https://www.amazon.com/musical-ly-Inc-TikTok/dp/B0117U0G3M

The Daily Free Press. (2011, April 13). Historically, the speech hesitation. https://dailyfreepress.com/04/13/11/177892/

Zhu, G., Caceres, J.P., & Salamon, J. (2022). Filler Word Detection and Classification: A Dataset and Benchmark. (arXiv:2203.15135v2 [cs.CL]).

[/expander_maker]
“Yearn for the Urn”: How Gen Z and Millennials Use Dark Humor on TikTok to Cope, Connect, and Perform Identity:

Fiona DeFrance, Monique Love, China Porter, Shriya Shekatkar, Lu Zhang

If you’ve ever laughed at a meme about depression and then paused to wonder if you were supposed to, you’re not alone. For Gen Z and Millennials, dark humor isn’t just a way to be funny, it is a form of emotional expression, identity work, and social bonding. On TikTok, this type of humor has taken on a life of its own, acting as both a coping mechanism and cultural signal. This blog will explore how these two generations use dark humor differently. Millennials, shaped by MySpace sarcasm and Adult Swim absurdity, tend to use humor to distance themselves from discomfort. Gen Z, on the other hand, often lean into it, using irony, vulnerability, and meme culture to face trauma head on. By analyzing patterns in TikTok videos, including the language people use, their emotional tone, and how viewers respond, we uncover how dark humor works as a powerful tool for navigating life’s messiness. Drawing on sociolinguistic theory (Bucholtz & Hall, 2005) and humor research (Samson & Gross, 2014), we show how generational identity, emotion, and community are shaped by digital jokes, and why they’re more meaningful than they might seem at first.

[expander_maker id=”1″ more=”Read more” less=”Read less”]

Introduction and Background

Why Joke About Trauma?

What does it mean when a TikTok about grief racks up millions of likes? Or when a stitched joke about student debt leads to hundreds of people commenting, “Too real?” For Gen Z and Millennials, dark humor, jokes that deal with death, anxiety, trauma, or mental health, is not just comedy. It’s a language of solidarity. It’s a way to say, “I’ve been there too,” without getting too earnest or heavy-handed. It’s not about making fun of pain, it’s about making pain bearable by laughing through it. What’s striking, however, is that while both generations lean into this humor, they do so in different ways. Millennials often rely on sarcasm and absurdity to create emotional distance from the discomfort they feel. Their humor is layered, witty, and steeped in cultural references. Gen Z, on the other hand, tends to blend irony and sincerity, using dark humor as a way to be publicly vulnerable, often self-deprecating, chaotic, and confessional. These differences are deeply tied to each generation’s coming of age context and their digital fluency. This blog investigates how these generational styles of dark humor reflect broader identity performances on TikTok. We argue that this humor is a powerful communication tool for expressing emotion, belonging, and generational identity. Through an analysis of both videos and comment threads, we explore how people use humor not just to entertain, but to cope and connect.

Same Joke, Different Vibe

Millennials, born between 1980 and 1994, were the first generation to grow up alongside the internet. Their humor was shaped by platforms like Tumblr, Reddit, and meme forums, where sarcasm, nihilism, and absurdism flourished. Broderick (2018) describes Millennial humor as “cultural therapy,” often used to intellectualize or distance oneself from emotional discomfort. Shows like Rick and Morty capture this smart, ironic, and deeply existential tone. Gen Z, born between 1995 and 2012, came of age in a digital world shaped by Instagram, Vine, and especially TikTok. Their humor style is faster, more fragmented, and more openly vulnerable. Jacob (2023) describes Gen Z humor as a “performance of authenticity,” in which users lean into self-mockery and emotional chaos to show relatability. Instead of hiding pain under wit, Gen Z often makes the pain itself the joke. This shift can be understood through the sociolinguistic lens of Bucholtz and Hall (2005), who argue that identity is not fixed but constantly performed through language and interaction. On TikTok, dark humor becomes a discursive tool, a way to perform who you are and to whom you belong. A single comment like “same bestie 😭” signals not just shared feelings, but shared values and generational belonging.

Methods

What We Watched and How We Looked

To explore how dark humor operates differently across generations, we conducted a qualitative analysis of 10 TikTok videos that shared themes of trauma, grief, or existential dread. We chose videos that had hashtags like #genzhumor, #millennialhumor, #traumajokes, and #griefjourney to ensure generational and thematic diversity. These videos ranged from ironic skits to darkly humorous storytimes. From these 10 videos, we collected and analyzed a total of 236 top level comments. We coded the comments using several frameworks, humor type based on Samson & Gross (2014), emotional tone, generational markers, and linguistic style. We looked for common humor strategies, such as self-deprecation, irony, absurdism, or sarcasm, and also examined how emoji usage, slang, and hashtags helped signal generational identity and emotional intent. Rather than analyzing the content of the videos alone, we focused heavily on how users engaged with them in the comments. These interactions revealed how humor becomes collaborative, social, and identity-forming.

Results and Analysis

Patterns in Digital Dark Humor

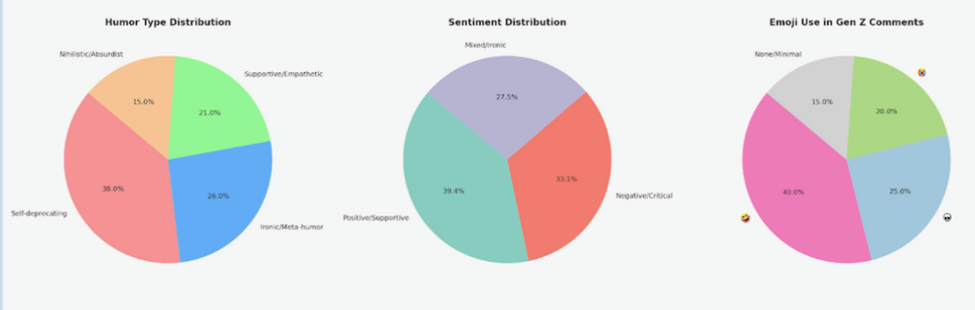
Across our sample, four major humor categories emerged. First, self-deprecating humor was the most common, accounting for 38% of comments. These included phrases like “crave the grave,” “I’m not laughing, I’m relating,” and “literally me 😭.” (See Figure 2, Humor Type Distribution). Next, ironic and meta-humor made up 26% of the comments, often blending sarcasm and detachment, such as “ghosting over a joke is crazy 💔” or “me laughing at this while sobbing IRL.” Supportive or emotionally affirming comments made up 21%, often taking the form of gentle validation like “she would’ve loved this” or “sending hugs to anyone who gets it.” Finally, nihilistic or absurd humor made up the remaining 15%, marked by comments like “damn again?” or “just another Tuesday in hell.” (See Figure 2).Looking more closely at generational patterns, we found that Gen Z-coded comments (n = 120) were typically short, fast-paced, and emotionally raw. Commenters used emojis like 🥲💀😭 to intensify their tone, often stacking them for emphasis. Phrases like “same bestie” and “real for that” appeared frequently, offering micro-validations that signaled both empathy and in-group belonging. This aligns with the high rate of emoji use seen in Gen Z comments (See Figure 2, Emoji Use in Gen Z Comments). Gen Z’s humor, which was deeply communal, inviting others to share in the emotional experience. Millennial-coded comments (n = 116), in contrast, were more likely to be narrative-driven. Users told short anecdotes or crafted witty one-liners like, “I screamed into my Trader Joe’s tote bag after watching this.” These comments often featured cultural references, dry sarcasm, or a clear setup-punchline structure. Emoji use was minimal, and tone leaned toward ironic detachment. This generational contrast is further illustrated in Figure 1, which shows Millennials using sarcasm more frequently and Gen Z relying more heavily on self-deprecation. Sentiment analysis revealed that 39% of all comments were supportive, 33% were negative or critical, and 28% blended irony with sincerity. (See Figure 2, Sentiment Distribution)These findings echo Van der Wal et al. (2022), who argue that humor can serve social regulation and bonding functions. On TikTok, we see this in real-time: a grieving user posts a dark joke, and strangers respond with humor, empathy, or shared experience, creating a temporary but powerful moment of digital solidarity.

Discussion and Conclusion

If you really want to understand  how young people cope with stress, loss, and mental health struggles, look past the punchline and into the comments. That’s where the real conversations happen. When a Gen Z user jokes about grief and someone replies “too real 🫠,” it’s not just a laugh, it’s an act of recognition. It says, “I get it. I’ve been there too.” For Millennials, telling a deadpan story about a panic attack on public transit isn’t just entertainment, it’s emotional processing disguised as comedy. What’s especially fascinating is how these generational styles also create boundaries, both of inclusion and exclusion. When someone from outside the in-group comments, “This isn’t funny,” Gen Z users often respond with layered irony or dismissive humor, reinforcing the communal tone of “if you know, you know.” Millennials might disengage or reply with a witty retort, maintaining their signature emotional distance. These micro-interactions show how humor doesn’t just express identity, it defines who’s in and who’s out. Ultimately, these humor styles reveal how differently each generation experiences and narrates vulnerability. Gen Z foregrounds emotional chaos and authenticity. Millennials lean on cleverness and control. Both, however, are trying to do the same thing: make sense of a world that often feels senseless. And in doing so, they build digital spaces where humor becomes survival, and connection.

If you really want to understand  how young people cope with stress, loss, and mental health struggles, look past the punchline and into the comments. That’s where the real conversations happen. When a Gen Z user jokes about grief and someone replies “too real 🫠,” it’s not just a laugh, it’s an act of recognition. It says, “I get it. I’ve been there too.” For Millennials, telling a deadpan story about a panic attack on public transit isn’t just entertainment, it’s emotional processing disguised as comedy. What’s especially fascinating is how these generational styles also create boundaries, both of inclusion and exclusion. When someone from outside the in-group comments, “This isn’t funny,” Gen Z users often respond with layered irony or dismissive humor, reinforcing the communal tone of “if you know, you know.” Millennials might disengage or reply with a witty retort, maintaining their signature emotional distance. These micro-interactions show how humor doesn’t just express identity, it defines who’s in and who’s out. Ultimately, these humor styles reveal how differently each generation experiences and narrates vulnerability. Gen Z foregrounds emotional chaos and authenticity. Millennials lean on cleverness and control. Both, however, are trying to do the same thing: make sense of a world that often feels senseless. And in doing so, they build digital spaces where humor becomes survival, and connection.

Figure 1: Sentiment and Humor Type Breakdown with Gen Z Emoji Use This set of pie charts presents three types of analysis from TikTok dark humor comments. Left: Humor Type Distribution—shows the proportion of humor types (Self-deprecating, Ironic/Meta, Supportive, Nihilistic/Absurdist). Middle: Sentiment Distribution—illustrates the emotional tone across comments (Positive/Supportive, Mixed/Ironic, Negative/Critical).Right: Emoji Use in Gen Z Comments—displays how frequently and in what style emojis appear, with 40% of comments using exaggerated or emotional emojis (e.g., 🤣😭💀), reinforcing Gen Z’s preference for hyperbolic and affective expression.

Figure 2: Comment Style Breakdown by Generation
This bar graph compares the comment styles used by Gen Z and Millennials in TikTok dark humor content. The x-axis shows the three main comment styles (Self-deprecating, Sarcasm, and Empathetic), while the y-axis represents the percentage of total comments in each style. Gen Z (blue) shows a higher rate of self-deprecating and empathetic comments, while Millennials (green) use more sarcasm overall

References

Broderick, A. E. (2018). ” Traumatized for Breakfast:” Why Millennials Respond to the Trauma, Comedy, and Dark Optimism of Rick and Morty. State University of New York at Stony Brook. https://www.proquest.com/docview/2138913981?pq-origsite=gscholar&fromopenview=true&sourcetype=Dissertations%20&%20Theses

Bucholtz, M., & Hall, K. (2005). Identity and interaction: A sociocultural linguistic approach. Discourse studies, 7(4-5), 585-614. https://doi.org/10.1177/1461445605054407

Jacob, R. (2023) Unveiling the Dark Humour and Self-Image of Generation Z in a Polymedia Context. The Criterion: An International Journal in English, 14, 215-26. [Journal-article].  https://www.the-criterion.com/V14/n4/LL07.pdf

Samson, A. C., & Gross, J. J. (2014). The dark and light sides of humor. Positive emotion: Integrating the light sides and dark sides, 169. https://books.google.com/bookshl=en&lr=&id=1vNQEAAAQBAJ&oi=fnd&pg=PA169&dq=how+dark+humor+operates+in+different+contexts+and+what+social+function+it+serves&ots=oJgSRN9EGw&sig=m4AO3FgFdMIjLutcRkYGcT8fh8#v=onepage&q=how%20dark%20humor%20operates%20in%20different%20contexts%20and%20what%20social%20function%20it%20serves&f=false

Van der Wal, A., Pouwels, J. L., Piotrowski, J. T., & Valkenburg, P. M. (2022). Just a Joke? Adolescents’ Preferences for Humor in Media Entertainment and Real-Life Aggression. Media psychology, 25(6), 797–813. https://doi.org/10.1080/15213269.2022.2080710

[/expander_maker]

Bro Talk: How Frat Slang Builds Brotherhood at UCLA

Ella Bogen, Celine Cabrera, Emily Henschel, Alexis Robles, Holly Weston

Ever walked past a group of frat guys and heard them say things like “ferda” or “that’s fire”? You might think it’s all just casual talk, but our research shows there’s something deeper going on. We studied how fraternity men use slang and nonverbal cues to build bonds, shape identity, and signal group belonging at UCLA. Language in Greek life is important, not just to sound cool, but to distinguish yourself as an “in-group” member, rather than an “out-group” member. Basically: you’re one of them.

Our project combined interviews, surveys, and real-world observations of frat interactions across several UCLA chapters. We wanted to know: does using more slang actually make you feel closer to your brothers? Our findings show that slang works like social glue, marking who’s “in” and who’s not, reinforcing group norms, and helping brothers navigate power dynamics within the house. Frat guys might not seem like linguists, but they’re constantly doing sophisticated things with language, whether they realize it or not. In fraternities, words like “bet,” “dub,” or even made-up phrases circulate through the house quickly. But this isn’t just meaningless banter. These words carry social weight. We see slang everywhere, but fraternities offer a unique take. They’re structured, male-dominated social groups where “brotherhood” is taken seriously, and shared language reinforces that sense of closeness. So we asked: Does using more slang actually make frat guys feel closer to one another?

[expander_maker id=”1″ more=”Read more” less=”Read less”]

Introduction and Background

Linguist Asif Agha (2015) says that slang exists in “microspaces”, which are defined as tight-knit communities where language choices reflect shared practices. Fraternities are a perfect example of this. Frat slang isn’t just just casual, they’re performances of masculinity and markers of group status. According to Asif Agha (2015), “Many kinds of slang coexist with each other within a language community and define many micro spaces of interaction linked to specific social practices and groups.” Fraternity members’ interactions are the types of microspaces that slang is prevalent within, which is why we chose them for our study, mainly focusing on the significance and role of slang in each interaction.

According to Yanchun Zhou and Yanhong Fan (2013), “If somebody uses the words and expressions within a certain social group or professional group, he will blend with the group members from mentality. That is to say, if a student says a sentence containing the special college slang, he must want to get the result of showing and strengthening the emotion that he is belonging to the inside of the teenager group.” This aspect of assimilation into a group through slang will be a core focus of our study. The idea of an “in-group” and “out-group” regarding understanding and employing slang is elemental to our theory on how slang functions to build social identity and reinforce group norms among fraternity men.

The idea of being in and out of “the know” is highlighted by the following excerpt: “In general terms, identity is realized when those people who are competent with a slang word come to infer that a speaker who uses is a member of the group for whom use is conventional based on their knowledge” (Alice Damirjian, 2024). A study done by Scott Kiesling shows that specific linguistic choices within groups like fraternities, such as slang, serve as markers of group identity and solidarity among fraternity members. He analyzes the “-in” variant among fraternity members and (e.g, “walkin” instead of “walking”).  Kiesling notes, “The -in form, through its widespread indexicality of casualness… is one of the resources Speed, Waterson, and Mick use to take these stances, along with other linguistic features.”(Scott Kiesling, 2005). This demonstrates how fraternities use specific linguistic forms to reinforce group cohesion through shared language.

In terms of linguistic properties typically found in the communicative patterns of slang among fraternity men, brothers often adopt distinct linguistic features that reinforce their group identity by differentiating insiders from outsiders. From an academic article by Pongsapan (2022), it is stated, “In the document analysis and questionnaire result, the researcher found that the students used language variations, especially slang in their interaction with various types, such as fresh and creative, compounding, imitative, acronym, and clipping.” Fraternity slang is reflective of this nature as most slang used by members is often a more casual and playfully coded language than standard, and often specific to Greek life. Phrases and expressions often reflect shared experiences, humor, or references that may be unintelligible to those outside the fraternity. The use of slang fosters familiarity and signals belonging.

Methods

We used a mixed-methods approach to capture how slang operates in these houses:
– Interviews: We sat down with UCLA frat members and asked them how their speech had changed since joining.
– Surveys: We gave participants Likert-scale questions and open-ended prompts.
– Naturalistic Observation: We attended casual hangouts to document body language and informal conversations.

Firstly we conducted a survey via Google Forms and collected 33 responses from Fraternity members in three different houses at UCLA. The survey included both closed and open-ended questions asking about their language use, perceptions of communication differences, and feelings of closeness with their brothers. Many of our questions were open-ended, so we conducted 3-5 minute one-on-one interviews with fraternity members for further data collection. We went deeper with interviews asking members how their language had changed overtime, how slang or jokes functioned in their house, and how these factors impacted their sense of identity and connection. Using both quantitative and qualitative methods helped us capture a fuller picture of fraternity communication. The survey gave us broader patterns, while interviews revealed personal experiences, shared rituals, and the emotional meanings behind the slang.  Altogether, these tools are what allowed us to analyze not just what was said, but how language operates in fraternity settings to reinforce bonds, in-group norms, and a unique culture.

Results and Analysis

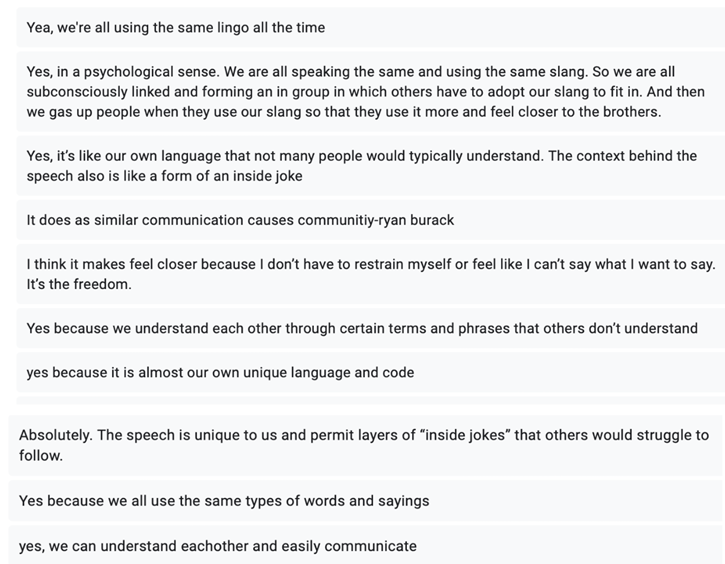
Figure 1: Answers to the question “Do you think the type of speech you use in the fraternity house makes you feel closer to your brothers? If so, why and how?”

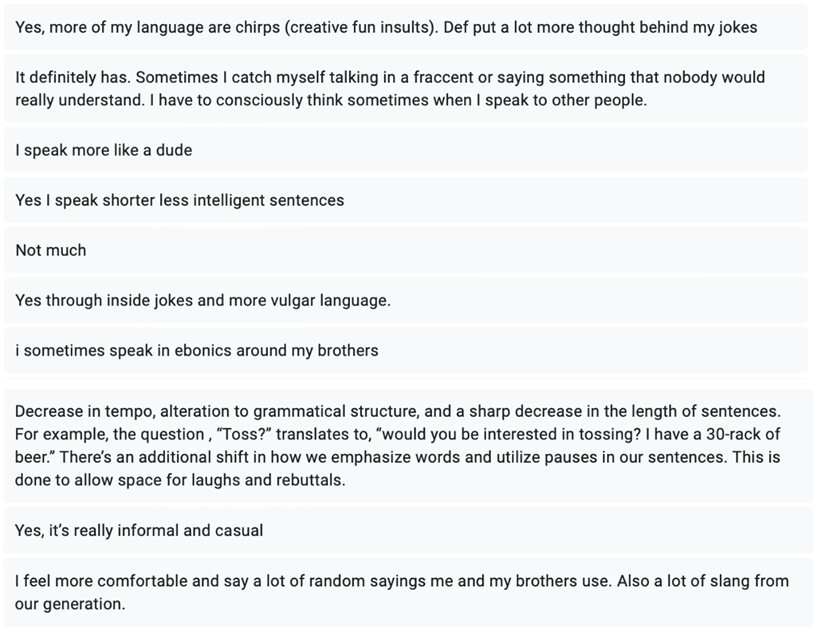
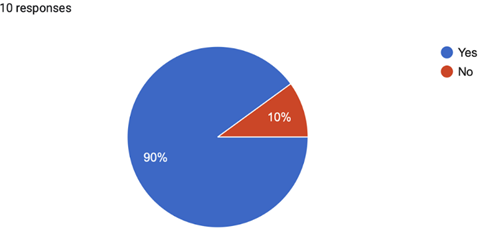
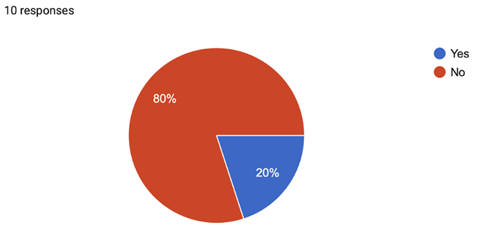
As seen in Figure 1, 100% of respondents agreed that the type of speech they used in the fraternity house made them feel closer to their brothers. Our survey also revealed that a majority of respondents felt their communication style had significantly changed since joining the fraternity (Figure 2). 90% agreed that they use house-specific slang specifically when within the frat (Figure 3). Interestingly, many also acknowledged that this language created an unintentional barrier to outsiders, and 80% of respondents believed that the average person would not understand the language inside the frat (Figure 4). This data highlights how slang functions not just as decoration, but as a central tool in building and navigating social dynamics within Greek life.

Figure 2: Has your language changed and adapted since joining a fraternity? If so, how?

Figure 3: In the house, do you think you speak differently?

Figure 4: Do you think the average person would understand slang said in the fraternity house among brothers?

Discussion and Conclusion

What the Brothers Said

One brother explained, “Yes, it’s difficult to describe, but there’s a lot of inside jokes, I would say, very, the least formal way that English can possibly be spoken” This sentiment came up often, that slang and inside jokes helped them feel more exclusively connected. Another said, “Um, Absolutely, but it’s difficult to describe. I would say it just comes down like limited vocabulary. For example, if we want to play a drinking game, we’ll just say just one word. Or going out, just go out. Sometimes, like, you get so close to each other, you could literally just point and it works. Kind of like, read each other’s minds.”

Another interviewee emphasized that their slang is constantly evolving: “
Like one person will say something funny and then it’s just kind of part of my lingo for at least like a month or two, and then before I know it, it’ll be something else.” This dynamic adaptation of language shows how slang reflects not only identity but also the constantly shifting social fabric of fraternity life, and the constant lexical changes we go through as a fast-paced generation.

The fraternity context also makes room for a specific kind of humor. “Like, I wouldn’t go insulting my classmates that I’m working on a group project [with], but, like, someone that I live with and, like, I’ve been through the thick of it with them, like, I feel all right, insulting them every once in a while. Totally.” This idea of bonding through teasing or “chirping” was repeated across multiple interviews. It illustrates that fraternity slang isn’t just about phrases; it’s about the tone, style, and culture of communication that define these relationships.

Future Directions

Our project opens up opportunities for questions and future research. Could intentionally modifying group slang affect bonding outcomes in new member orientations? Might there be a way to track how slang evolves in digital spaces like on GroupMe or Instagram DMs? As Greek life continues to adapt to changing campus climates and public perception, understanding the linguistic pulse of these communities may offer insights into broader shifts in masculinity, identity, and group belonging in Gen Z culture.

Our results were technically inconclusive, but heavily suggest a positive correlation between slang use and closer bonding. Slang in fraternities is a tool for navigating identity, forming friendships, and establishing social hierarchies. Our study shows that when frat brothers speak their own lingo, they’re doing more than talking. They’re building brotherhood, one “dub,” “ferda,” and “foenem” at a time.

References

Agha, A. (2015). Tropes of slang. Signs and Society, 3(2), 306–330. https://doi.org/10.1086/683179

Damirjian, A. (2025). The social significance of slang. Mind & Language, 40(2), 138–156. https://doi.org/10.1111/mila.12530

Kiesling, S. F. (2005). Fraternity men: Variation and discourses of masculinity. In D. Santa Ana (Ed.), Tongue-tied: The lives of multilingual children in public education (pp. 105–121). Routledge. https://www.researchgate.net/publication/316501721_Fraternity_Men_Variation_and_Discourses_of_Masculinity

Pongsapan, N. P. (2022). An analysis of slang language used in English students’ interaction. Jurnal Onoma: Pendidikan, Bahasa dan Sastra, 8(2), 917–924. https://e-journal.my.id/onoma

Zhou, Y., & Fan, Y. (2013). A sociolinguistic study of American slang. Theory and Practice in Language Studies, 3(12), 2209–2213.

[/expander_maker]
Profanity on Play: Analyzing Cursing Patterns of Male and Female Streamers

Izze Castillo, Sophia Le, Simon Oh, Kenneth Tran, Bryan Nguyen

Just died in a game? What’s the first word that comes out of your mouth? This study examines gender-based differences in profanity use among popular gaming streamers to explore how digital platforms reflect and reinforce societal norms related to language and gender.

Existing literature indicates that men generally use profanity more frequently and with greater intensity than women, and that such behavior is often socially accepted or even valorized in men while criticized in women (Bailey & Timm, 1976). Drawing on prior sociolinguistic and gender communication research, this study analyzes the speech patterns of eight prominent male and female streamers, focusing on the frequency, direction, intensity, tone, function, and contextual usage of expletives during gameplay. We hypothesize that men will use direct profanity at a higher frequency, intensity, and variety, using it to express anger and dominance during gameplay, whereas women will use milder swear words at a lower frequency to be more emotionally expressive and maintain relationships. By identifying patterns in swearing behavior across genders in streaming contexts, we can understand how gendered language norms exist and change in online environments.

[expander_maker id=”1″ more=”Read more” less=”Read less”]

Introduction and Background

Gamers have become a major source of online entertainment. They are especially popular among younger generations, who see them as more relatable and authentic than traditional celebrities. Profanity is everywhere in streaming but it’s not treated the same across genders. Male streamers are often seen as funny and entertaining when they swear, compared to females who are seen as rude or inappropriate.

Existing studies comparing the swearing differences between male and females have found that men typically use more intense swear words, swear more in public, and have a larger profanity lexicon than women (Bailey and Timm, 1976). Regarding public perception, men find women who swear less attractive while women find men who swear more attractive (O’neil, 2001). These findings point to gender norms in that cursing is associated with dominance and masculinity. Women who curse may be perceived as deviating from these norms and face more intolerance towards their speech patterns (Lakoff, 1972). Interestingly enough, recent studies have shown that women do not curse drastically less than men, as the rise of social media has increased the swearing rates of younger generations of women (Tikile and Ngulube, 2025). While most studies cover general gendered swearing patterns, we are interested in examining swearing patterns in streaming contexts and if societal gender norms are still enforced on digital platforms. In our study, we analyze the top gaming streamers by analyzing their swearing patterns, identifying trends regarding their speech.

Methods

To explore swearing patterns used in live-streaming environments, our group focused on a select group of popular Twitch streamers: Kai Cenat, Ninja, Caseoh, Jynxzi, Pokimane, Valkyrie, Loserfruit, and Kyedae. They all had at least a million followers and ten million hours of watched content. The streamers also played the shooter games such as Fortnite, Valorant, and PUBG, where entertaining viewers and performing well simultaneously is a key part of their content. We observed how the streamers communicated in various situations, such as under pressure, intense gameplay, moments of frustration, joking with friends and viewers, or reacting to unexpected events of the game.

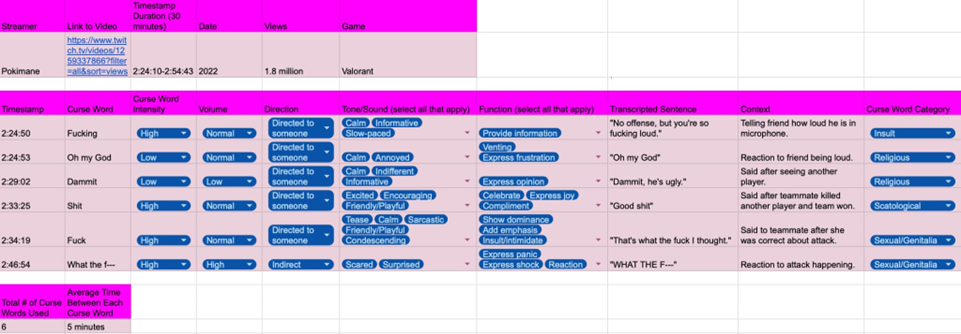
In a chart, we documented every instance of a curse word within a thirty minute streaming segment and noted its different features. For example, we noted specific profanity used and its intensity. We also observed who or what the curse word was directed to (e.g., the game, the gamer, another player, general conversation, etc.). We noted the volume and tone in which the profanity was delivered (e.g., excited, frustrated, surprised, calm). We also categorized each curse word by type (e.g., sexual, scatological, religious, slur, expletive) and documented the context as well as transcripted sentence in which the word was used. Finally, we noted the function of swearing, such as expressing frustration after dying in the game, emphasizing excitement or disbelief, or entertaining the audience. All data was recorded manually in a spreadsheet where each member documented the curse word and selected tags that applied to the word. Each streamer was viewed twice by members which allowed us to cross-reference observations and resolve disputes in different interpretations of the data, ensuring accuracy and consistency. In the end, we tallied the total number of curse words used in the segment as well as the average time between each curse word for each streamer.

Figure 1: Data collection chart for cursing behavior of streamer “Pokimane” with tags selected for each feature of curse word.

Results and Analysis

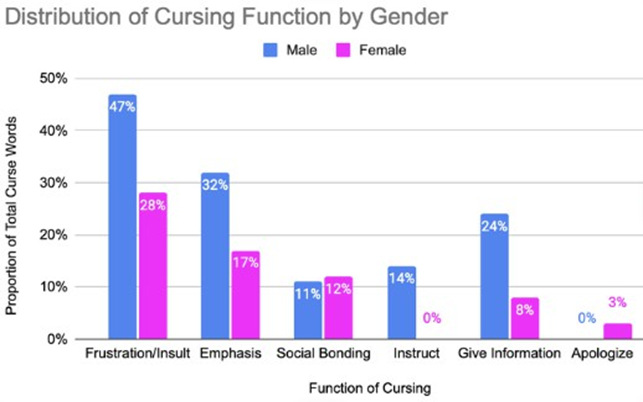
Figure 2: Bar chart showing distribution of cursing functions between male and female streamers in proportion of total curse words.

Our analysis reveals that there are distinct gender-based differences in both frequency and function of cursing across male and female streamers. For male streamers, their overall
frequency was much higher than female streamers with 85 total instances compared to 36 instances for women. For the function of cursing, we can see in Figure 2 how male streamers mostly employed it as a way to express frustration or insult 47% of the time and emphasize 32% of the time. In contrast, female streamers used cursing for those functions 28% and 17% of the time, respectively. Male streamers used curse words to instruct 14% of the time while women never used it for that purpose. Conversely, women used cursing to apologize 3% of the time while men never used it for that purpose. This may suggest that women tended to be less confrontational and more intentional with the way they relationally used profane language.

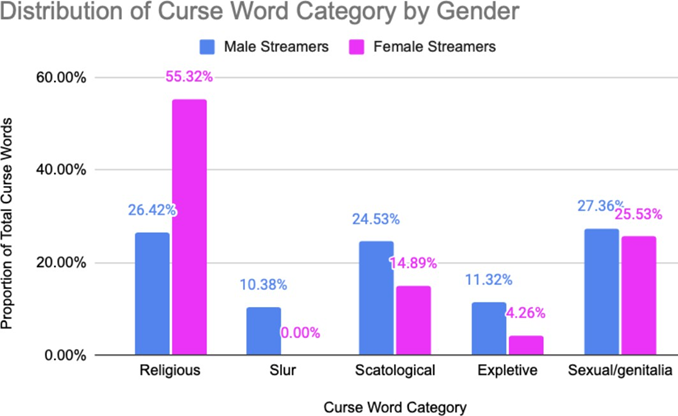
Figure 3: Bar chart showing distribution of curse word categories between male and female streamers in proportion of total curse words.

As far as the type of curse words in Figure 3, female streamers overwhelmingly favored milder, religious profanity, accounting for over half of their total curse words at 55.32%. Male streamers, on the other hand, displayed a broader distribution of slurs (10.38%), scatological terms

(24.53%), and sexual language (27.36%), suggesting their appeal for more intense profanity. This may highlight how male streamers may feel more dominant or accepted by other men, especially in their community, if they adopt the “Boys will be boys!” mentality and incorporate more sexual and derogatory forms of profanity. Women, conversely, must make up for their use of profanity by catering towards less offensive forms and abide by social conventions.

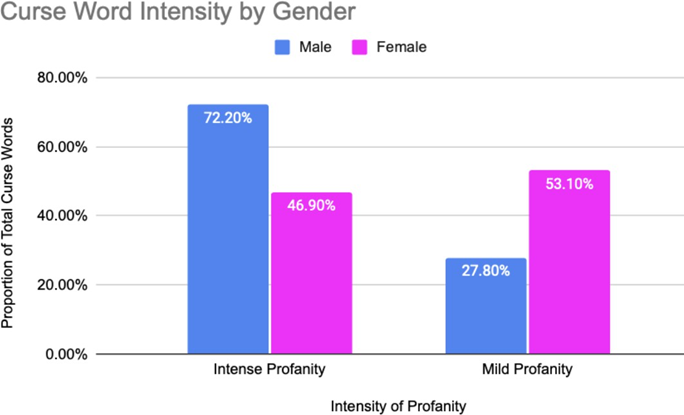
Figure 4: Bar chart showing distribution of cursing intensity between male and female streamers in proportion of total curse words.

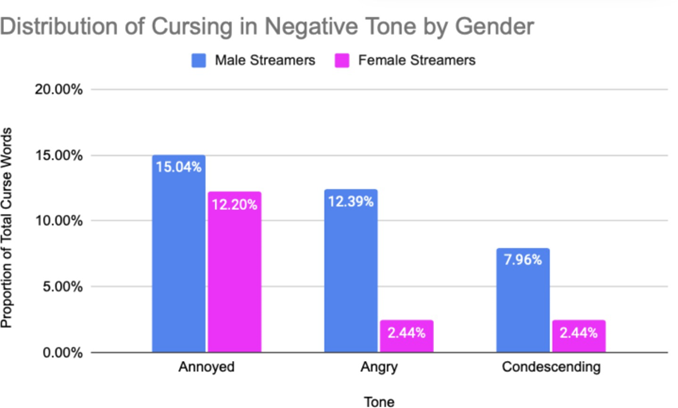
Figure 5: Bar chart showing distribution of cursing in negative tones between male and female streamers in proportion of total curse words.

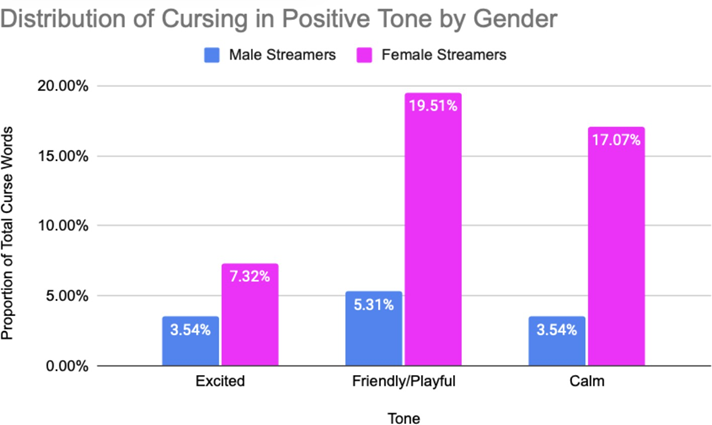
Figure 6: Bar chart showing distribution of cursing in positive tones between male and female streamers in proportion of total curse words.

Lastly, in examining emotional tone, we found that men were more likely to curse in a negative tone, such as sounding annoyed (15%), angry (12%), or condescending (8%). Women were more likely to curse in positive tones, such as friendly/playful (20%), calm (17%), and excited (17%). For the angry and condescending tone in Figure 5, we can see a drastic difference between how much men employed these tones compared to women, who used them just 2% of the time. In Figure 6, this pattern is reversed for positive tones in that women embodied this attitude at a significantly higher rate than men, who only used it 3-5% of the time. These findings suggest that profanity use is not just a matter of vocabulary, but reflects deeper gender communication norms. Male streamers tend to use curse words to assert dominance, frustration, or authority, often paired more intense and negative emotional tones. Women, however, employ profanity more creatively or socially to integrate it into positive and affiliative expressions. This gendered contrast highlights how language, even profanity, is shaped by broader patterns of social behavior, emotional expression, and interactional goals.

Discussion and Conclusion

All in all, our hypothesis was supported in that men used direct profanity at a higher frequency and intensity to express anger, while women used it at a milder, lower frequency to maintain relationships. We can see how both male and female cursing patterns reflect broader gender norms as communication is shaped by culture and societal pressures, even in digital spaces. Men employ profanity to express masculinity, dominance, and intimidation, while women tend to conform to their expectation of maintaining proper, socially acceptable behavior by regulating their profanity to build rapport. This reflects their subordinate, emotionally sensitive role compared to males as they may feel moderating language helps them remain approachable and likable. Previous studies support these findings such as Coates (2015) and Lakoff (1975) in highlighting women’s adherence to cautious, civil behavior in public settings.

Men may not have this capability to regulate emotions as well as they are more aggressive and their brains simply do not have the potential to cope with intense emotions as well as female brains (Güvendir, 2015). This biological basis has shaped gender roles in determining what communication patterns are appropriate for each gender and therefore dictates how people perceive those who conform and deviate from such conventions. Audiences may not receive female cursing as well as male cursing as it’s unconventional for females to use harsh language, prompting a more restrained, lighthearted usage in fear of judgment. Males, however, may be perceived as powerful and admirable in establishing dominance, allowing for more frequent cursing. As gaming is a rapidly evolving environment, it’s important for streamers to recognize these norms and understand the differences in audience perception. Streamers must navigate challenges in maintaining authentic personas and simultaneously conform to gender expectations to resonate and attract viewers that will appropriately receive their content and language style.

References

Bailey, L. A., & Timm, L. A. (1976). More on Women’s — and Men’s — Expletives. Anthropological Linguistics, 18(9), 438–449. http://www.jstor.org/stable/30027592.

Coates, J. (2015). Women, Men and Language: A Sociolinguistic Account of Gender Differences in Language (3rd ed.). Routledge. https://doi.org/10.4324/9781315645612.

Güvendir, Emre. (2015). Why are males inclined to use strong swear words more than females? An evolutionary explanation based on male intergroup aggressiveness. Language Sciences, 50, 133-139. https://doi.org/10.1016/j.langsci.2015.02.003.

Lakoff, R. T. (1975). Language and woman’s place. Harper & Row.

O’neil, Robert Paul. (2001). Sexual Profanity and Interpersonal Judgement. LSU Historical Dissertations and Theses. https://repository.lsu.edu/gradschool_disstheses/427.

Tikile, E. A., Ngulube, I. E. (2025), The Usage of Swear Words Among Generations X, Y and Z in Rivers State University. International Journal of Literature, Language and Linguistics 8(1), 37-49. 10.52589/IJLLL-7YPDRYKS.

[/expander_maker]
“You’re SOO Pretty, Girl!”; Decoding the Power Behind Compliments

Makenna Grewal, Maryam Zakar, Genesis Maciel, Lauren Sadighpour, Ivelisse Castro

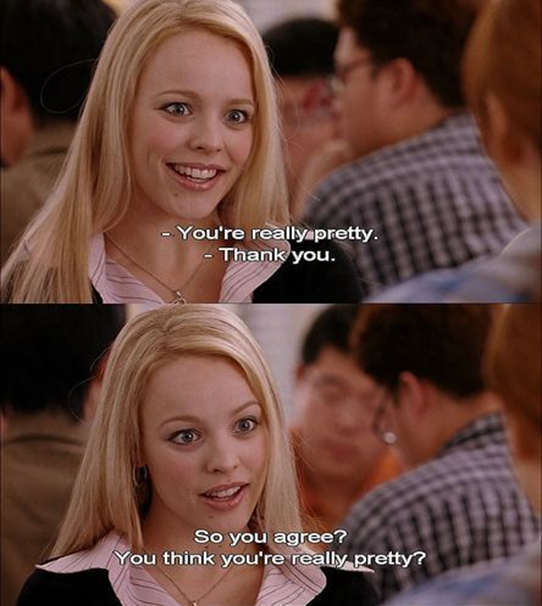
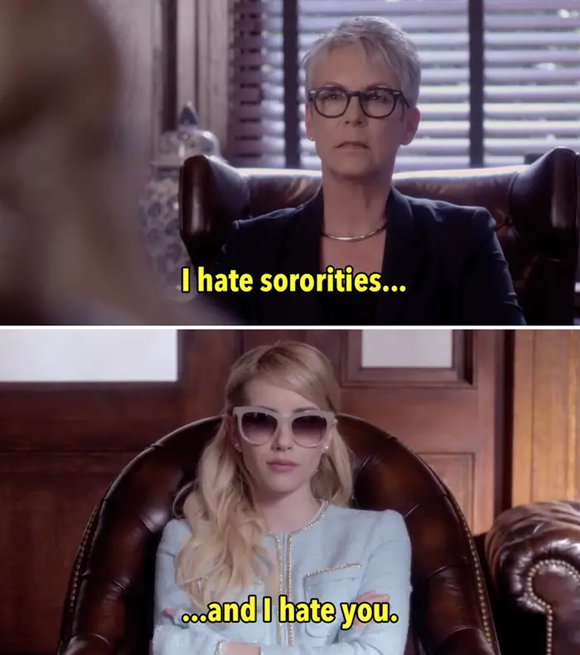
You’re standing in the crowded corner of Roccos, celebrating the end of this stressful quarter. A girl you just met smiles at you and says, “Wait, you are literally so pretty.” You immediately thank her, and your heart warms with appreciation…but you’re left wondering. Did she really mean it, or was she just being nice? Was it just a part of the social norm? Why do these moments feel so flattering yet strangely loaded? This exact confusion that most of us have experienced sparked our research. We set out to explore how compliments are used by undergraduate women at UCLA, comparing those involved in Panhellenic sororities and those who aren’t affiliated with Greek life. Our curiosity drove us to understand how something as simple as a compliment can carry layers of meaning, friendship, expectation, and even social power. Through surveys, we found that compliments aren’t just about being nice. They are tools that can sometimes be sincere, sometimes strategic, and sometimes expected to help women navigate identity, group belonging, and unspoken social hierarchies. (Figure 1: Regina George, played by Amy Adams, in movie Mean Girls)

[expander_maker id=”1″ more=”Read more” less=”Read less”]

Introduction and Background

At UCLA, Panhellenic sororities serve as hubs of social life, where language plays a significant role in shaping connections, identity, and a sense of belonging. The subtle yet powerful tool of compliments is crucial in shaping these interactions. But the common question is what exactly happens in these exchanges, and how distinct are they compared to women outside of the Greek Life bubble? This intriguing question led to a deeper exploration into the complexities of everyday communication among younger women. Frequently, sororities make headlines for their perceived social image, sisterhood, and extravagant events, but the nuanced day-to-day interactions that truly define these relationships often go unnoticed. Compliments are perceived as simple affirmations of admiration and are categorized as casual speech, yet they hold intricate layers of significance. They reinforce group cohesion, used as a tactic to navigate social hierarchies, and influence personal identities. After recognizing this unexplored realm, our study aims to compare these interactions between sorority-affiliated women and their peers outside the Greek community. This research is essential to identify the mechanics of social belonging while uncovering how power dynamics and identity negotiations occur in everyday conversations. To accomplish this, we have designed surveys and quantitative research methods focused on dyadic, or one-on-one, interactions among women aged 18-23. By analyzing their experiences, we strive to uncover whether sorority life uniquely shapes communication or if broader cultural factors influence all women’s interactions similarly. Ultimately, this research aims to gain a deeper understanding of how undergraduate women navigate their daily lives within various social structures.

Methods

To examine the use of gendered communication through the use of compliments among college women, our research employed a comparative study of undergraduate women at UCLA, focusing on two groups: women that belonged to sororities and those unaffiliated with greek life. Our goal was to explore how compliments, both verbal and nonverbal, function in how young women build relationships, reinforce identity, and negotiate social dynamics between these groups.

Our research utilized two separate surveys that asked the same questions, though distributed separately among sorority members and non-sorority members. The survey included both quantitative questions, such as frequency and context of compliment use and qualitative questions, for example, descriptions of specific instances in which compliments were given, exchanged, or received. The questions we included in the survey was designed to capture patterns among and between the groups, in addition to their individual perspectives of their lived experiences in this context. Participants were asked about their communication habits in everyday social settings, such as hanging out casually with other girls, social events, and through digital platforms, and how they perceive compliments to be used and received in those interactions.

Our analysis placed an emphasis on the observable elements of communication such as linguistic style, nonverbal behavior, and contextual cues. We applied thematic analysis to qualitative responses to identity recurring patterns in how compliments were used between the groups. The use of discourse analysis in our research enabled us to analyze the functioning of language and communication in reinforcing group norms or upholding social hierarchies. Lastly, comparative analysis was employed in our study to highlight the differences and similarities in the strategies of communication and the function of compliments used by both sorority and non-sorority women. By examining self-reported survey responses, we hoped to gain a thorough knowledge of how young women at UCLA manage social belonging and identity through gendered communication

Results and Analysis

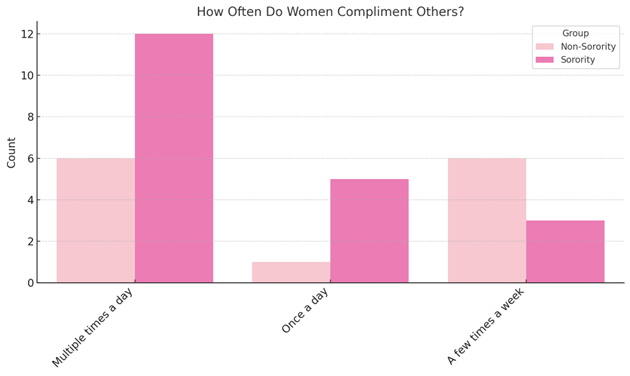
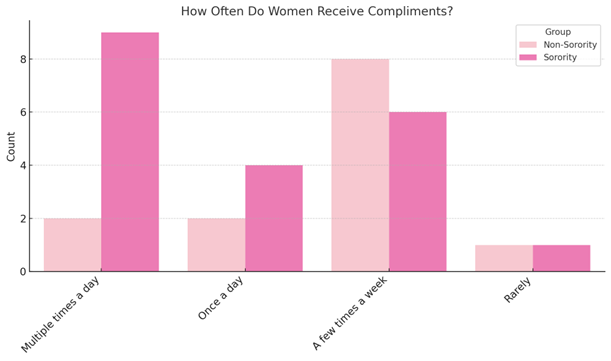
Sorority women report both giving and receiving compliments more frequently than their non-affiliated peers, with many engaging in this exchange multiple times a day. This elevated volume supports the idea that sorority life involves more frequent social interactions where compliments function as everyday tools for communication and cohesion. The constant flow of affirmations may reflect not only a culture of positivity but also an underlying strategy—compliments can be used to reinforce group identity, affirm social standing, or ease interpersonal dynamics. These patterns align with the project’s hypothesis that Greek life intensifies both the frequency and function of compliments, making them a central part of navigating relationships and maintaining one’s place within a tightly knit social hierarchy.

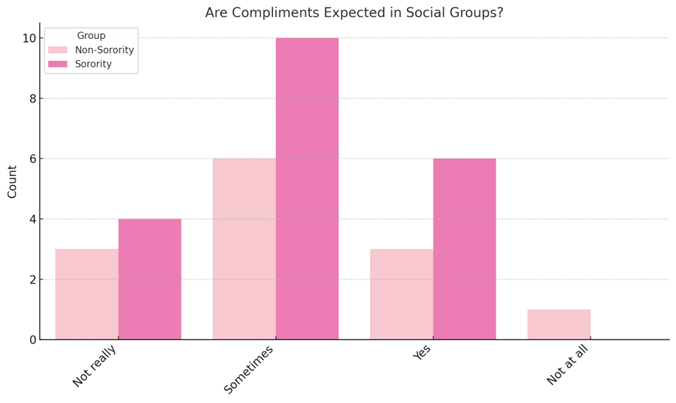
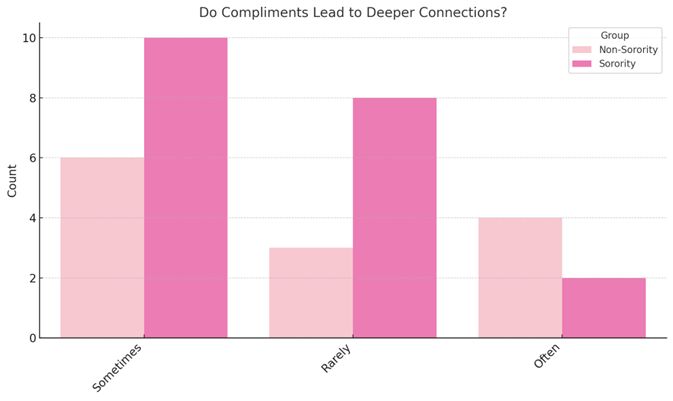
Sorority women more frequently perceive compliments as a social expectation, which suggests that these exchanges are not just spontaneous acts of kindness but part of a broader communication norm within their community. This expectation may foster a culture where compliments serve as a kind of social currency—used to maintain group harmony, affirm alliances, or smooth over tensions. Additionally, the finding that compliments more often lead to deeper conversations or bonding among sorority members reveals their higher social utility. Compliments in these settings appear to function as gateways to relationship-building and group integration, helping women establish rapport and navigate the layered dynamics of Greek life. In contrast, for non-sorority women, compliments may remain more surface-level, serving as gestures of kindness without necessarily opening the door to a closer connection.

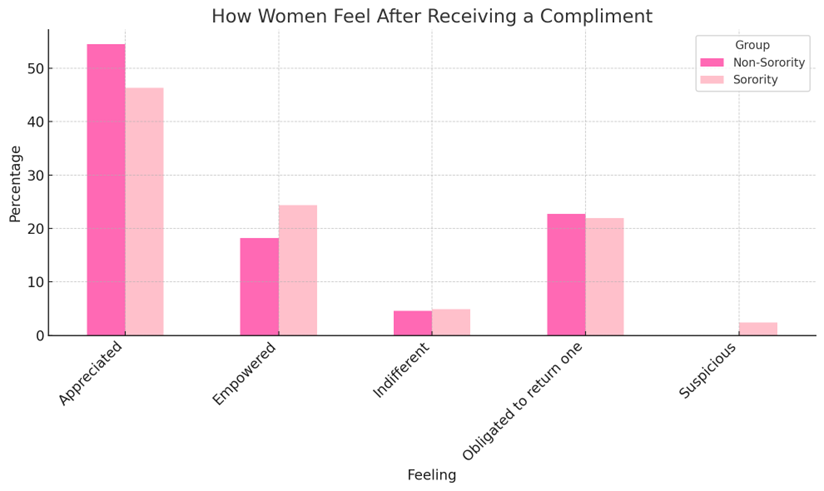
Both sorority and non-sorority women overwhelmingly report feeling appreciated after receiving a compliment, suggesting that affirmations are generally well-received across groups. However, sorority women are also more likely to feel empowered (50% vs. 30.8%), indicating that compliments may play a stronger role in reinforcing identity and confidence within Greek life. They also report feeling obligated to return the compliment more frequently (45% vs. 38.5%), hinting at social expectations or pressure to reciprocate. Notably, only sorority women reported feeling suspicious, which may reflect an awareness of strategic communication or unspoken power dynamics in their social circles.

Discussion and Conclusion

By examining the role of compliments among sorority and non-sorority girls at UCLA, this study contributes to a broader understanding of how compliments serve as mechanisms of social bonding and power negotiations in female social networks. It offers valuable insight into how gendered communication influences the way young women connect with one another. Popular media and television often depict female interaction as superficial or ingenuine, reinforcing dismissive stereotypes for comedic or dramatic effects. In contrast, our findings illustrate that language not only reflects social norms but also shapes relational dynamics within our social network.

This observation is supported by Ayers (2012), who discusses how compliments and seemingly kind remarks can also function as tools of relational aggression or competition, particularly among young women navigating subtle forms of power. Compliments, in this sense, are not always innocent; they can act as veiled strategies to assert dominance or reinforce group boundaries. Bryan’s (2013) research on sorority women reinforces this dynamic, illustrating how identity control theory plays out in Greek life through continual feedback—where compliments help regulate behavior and self-presentation within tight-knit groups. These findings align with our participants’ reports of both empowerment and pressure, especially among sorority members, who often experience compliments as part of a broader system of expectation, social maintenance, and inclusion.

Although the sample of young women is limited to UCLA specifically, the patterns observed in our findings support the phenomenon of power dynamics shaping female relationships across various social contexts and in fact challenge traditional assumptions about stereotypes embedded in sorority and non-sorority discourse. By recognizing the power compliments hold in day-to-day communication, the study helps highlight the significance female dynamics play in shaping social hierarchies and networks-demonstrating how language can elevate, encourage, include, and ultimately empower the bonds women create over time. Moreover, understanding these nuanced communication patterns encourages more mindful interactions that can foster genuine connection and challenge superficial stereotypes within female social networks.

(Figure 2: Chanel Oberlin, played by Emma Roberts, in TV series Scream Queens)

References

Ayers, Danielle, “Queen Bees: An Examination of the Mean Girl Phenomenon” (2012). Honors Theses. 767.

Bryan, H. (2013). The Sorority Priority: The Role of Interactional Feedback Mechanisms in Shaping Body Image in Sororities.

Frankenberger, W. R. (2024). Relational Conflicts Experienced Through Digital Platforms Among Generation Z Sorority Women (Order No. 31146923). Available from ProQuest Dissertations & Theses A&I; ProQuest Dissertations & Theses Global. (3068910761). www.proquest.com/dissertations-theses/relational-conflicts-experienced-through-digital/docview/3068910761/se-2

Rees-Miller, Janie. “Compliments Revisited: Contemporary Compliments and Gender.” Journal of Pragmatics, vol. 43, no. 11, Sept. 2011, pp. 2673–88. DOI.org (Crossref), doi.org/10.1016/j.pragma.2011.04.014.

Sasso, P., Manning-Ouellette, A., Bullington, K., & Price-Williams, S. (2024). White Girl Wasted: Gender Performativity of Sexuality with Alcohol in National Panhellenic Conference Sorority Women. Georgia Journal of College Student Affairs, 40(1), 32–61.

[/expander_maker]
Expressing Anger in Japanese and English Bilinguals

Kevin Kim, Shoichiro Kamata, Karin Yamaoka, Raine Torres, Max Fawzi

Japanese is often erroneously considered a “swearless language”, but anyone who has ever been yelled ‘しね’ (meaning ‘to die’) will confidently tell you that like all languages, Japanese has diverse ways of encoding abusive language. In Japanese ‘しね’ only becomes abusive language when in the context of being an insult, but in everyday situations the word simply means ‘to die’ without any connotation of insult. English differs from Japanese by having explicit profanities that carry a vulgar meaning independent of its usage context or syntactic environment. We conducted the following research to discover the discrepancy of semantic typology between Japanese and English profanities or abusive language, and if bilingual speakers endow varying emotional intensity to English profane lexica compared to Japanese abusive language. Our study shows that L1 Japanese L2 English bilinguals view English profanities as less offensive than their L1 English counterparts, report using these English profanities more frequently, and view the equivalent Japanese abusive language as more offensive.

[expander_maker id=”1″ more=”Read more” less=”Read less”]

Introduction and Background

Languages differ significantly in how they encode and express emotions, particularly when it comes to the use of profanity as a means to express anger (for example in the context of an argument). This study examines profanities as a distinct subset of lexicon characterized by inherently vulgar or aggressive meanings, distinguishing them from other words or expressions that acquire such connotations only through context. In other words, in this paper, profanities refer to lexically explicit terms such as ‘fuck’ in English, that convey hostility or vulgarity without the necessity for context, and argue that Japanese lacks such a distinct subset, since words like  ‘しね’ (meaning ‘to die’) can convey aggression or intensity, but lack the explicit vulgarity found in English profanities. This study thus examines and defines profanities as vulgar lexica (found often in English) where its vulgarity is unaffected by its syntactic environment or context; distinguishing them from abusive expressions that only acquire offensive undertones within specific contexts (found often in Japanese). More specifically, Japanese speakers use “various markers of register rather than the explicit deployment of dysphemistic lexical items or expressions” (Jackson & Kennet 2021,1), where connotation of abuse is only endowed through syntactic and environmental inferences (context in which it is being used) even though there can be contextually impolite vocabulary derived from anatomical, excretory, and sexual sources like in English (Hoshino 1971, 31). We will refer to the vulgar and aggressive lexica of English as ‘profanities’ whereas ‘abusive language’ will be used for their Japanese counterpart lexica.

We argue that current studies on Japanese do not accurately reflect empirical use of abusive languages by native speakers. Medias (e.g. anime) that use more performative language tends to distort the perception of how Japanese speakers use language as media lexicons are often unreflective of native speakers’ lexicons. Through this study, we aim to focus on what native speakers consider to be consistently employed in their everyday language.

With our definition of profanities, it assumes a discrepancy of linguistic equivalence between English profanities and Japanese abusive language in its aggressiveness in its use. Therefore, it raises a question; How do Japanese L1 and English L2 speakers juggle the two discrepant lexical categories of ‘profanities’ and ‘abusive language’ and navigate through the lack of equivalence as a bilingual?

We aim to gain an understanding of the cognitive processes that occur for bilingual speakers, when conceptualizing constructs that are not lexically represented in their L1 and discrepancies in linguistic equivalence.

A research by Dewaele (2016) offers a valuable insight into self-reported perception of English swear words by L2 English speakers. The findings show that English LX users (non-native English speakers) over-estimate the offensiveness of most negative emotion-laden words, and avoid using most offensive emotion-laden words. On the other hand, a relevant study by Gawinkowska et al. (2013) found that bilingual speakers are more hesitant to use strong expletives in their L1 than in their L2, likely because they feel less bound by normative influences when speaking in their L2. As such, existing research has presented conflicting results, adding layers of complexity to bilingualism and emotional perception of abusive language in L2 languages.

We expect cultural aspects to play a role in the perception as well; Japanese cultural norms generally discourage direct expressions of intense emotion. One way this manifests is through face, as in outward appearances. Lin & Yamaguchi (2011) state that Japanese culture places greater importance on saving face, as face in collectivist cultures is concerned with an individual’s position in the social hierarchy rather than personal achievement like in individualistic cultures; there is also a tendency to avoid conflict and maintain interpersonal harmony in collectivist cultures. By directly expressing strong emotions, one would lose face in Japanese society and thus there is a social pressure against directly expressing intense emotion. Synthesizing the relevant studies and Japanese cultural aspect, we hypothesize that L1 Japanese speakers will perceive English profanities as being less emotionally charged than their L1 English counterparts. We can also expect L1 Japanese speakers to rate Japanese abusive language roughly the same as their English profanity counterparts or as less offensive overall.

Methods

2.1 Participants

The population of our study is L1 Japanese L2 English speakers, with our control group being L1 English speakers having no knowledge of Japanese. L1 Japanese L2 English bilingual participants are Japanese nationals who did not grow up speaking English at home; their English proficiency were established in the demographic section of the survey including questions regarding their language background. Furthermore, all participants are current college students for ease of recruitment and consistency, putting the age range between 18-28 years old, an age group which likely has the same general vocabulary and therefore slang/profanities, allowing for more homogenous data.

2.3 Design

The survey method was chosen to measure perceptions of both Japanese abusive language and English profanity. It consisted of two phases, where phase 1 focuses on the translation and interpretation of English profanities, and phase 2 focuses on the emotional charge and frequency of use of profanities.

2.3.1 Phase 1

Japanese media often, for performative effect, distorts how abusive language is used; this however does not reflect how native speakers use abusive language. We thus established a list of 10 Japanese abusive expressions with our own English translations, and asked a group of L1 Japanese L2 English speakers (N1 = 14, 7 male, 7 female) to translate the predetermined English words into Japanese. The results became a basis for the subsequent phase and also a tool to identify abusive lexica that native speakers (18~28) actually use.

2.3.2 Phase 2

A separate survey was sent to both our control group (N2 = 16, 8 male, 8 female) and to our experimental group (N3= 13, 3 male, 10 female). The survey asked participants to rate on a 5-point scale (1 = very low, 5 = very high) with regards to a given abusive expression/profanity (1) how well they understand the meaning, (2) how offensive/emotionally charged it is, and (3) how frequently they use it. The control group of L1 English speakers rated solely English profanities, while our experimental group rated both English profanities and Japanese abusive language.

2.4 Manipulation            

To standardize the implied usage context of the profanities (as emotional intensity could be influenced by the varying situations that participants imagine its usage to be), every survey were presented with a GIF of two men arguing, to standardize the perception that the profanities/abusive language in question are used by a person demonstrating anger. Moreover, phase 2 had two versions of the same survey, where Version 1 asked participants to rate English profanities first and of Japanese abusive language second, and vice versa. This was done in hopes of mitigating anchoring effects or priming effects that could bias our findings.

Figure 1: GIF presented to participants during phase 2 survey 

Results and Analysis

3.1 Phase 1 Results

This phase primarily served to establish the abusive language in Japanese that reflected the actual terms used by native speakers. A key finding was in regards to the perception of “shit” and “fuck”: L1 Japanese speakers tend to view “shit” and “fuck” as synonymous when translated into Japanese. Approximately 86% of respondents translated both “shit” and “fuck” as 「クソ」(kuso). This pattern likely reflects the absence of a direct Japanese equivalent for the word “fuck.” Instead, respondents opted for 「クソ」(kuso), which semantically corresponds more closely to “shit” as it denotes fecal matter. This semantic overlap highlights a gap in linguistic equivalence, influencing the way these terms are interpreted and used in the context of L1 Japanese speakers.   

Another key finding was that the translations for “dumbass” and “moron” were predominantly split between two responses: 「バカ」(baka) and 「あほ」(aho). Slightly more respondents translated “dumbass” as 「バカ」(baka), while “moron” was slightly more frequently translated as 「あほ」(aho). For the subsequent phase of the study, we selected the more commonly chosen translation for each term, though the differences were minimal. This suggests that, for Japanese speakers, profanities targeting intellectual levels exhibit limited variability in their translations, possibly reflecting a convergence in semantic interpretation.

The patterns presented were indicative of the nuanced ways in which abusive language is conceptualized and translated by L1 Japanese speakers. Specifically, the findings highlight the challenges of mapping English profanities to Japanese equivalents due to cultural and linguistic differences.

3.2 Phase 2 Results

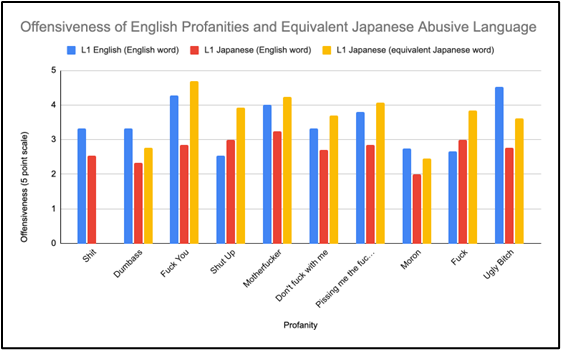
Quantitative analysis of phase 2 reveals that on average L1 Japanese bilinguals view English profanities as 0.73 less offensive on the 5 point scale than L1 English speakers, with our experimental group rating the 10 English profanities as an average of 2.73, and the control group rating them as 3.45. The largest differences were found in “Ugly Bitch” (difference of 1.76) and the more commonly used “Fuck you” (difference of 1.42), which reflects a significantly different attitude towards even more common swearwords. Our experimental group also viewed the two most commonly used profanities “Shut Up” and “Fuck” as more offensive, with small differentials of 0.47 and 0.33 respectively. Our experimental group however, also rated the selected 9 Japanese translations at an average of 3.70 on the offensiveness scale (i.e. 0.25 higher than the English profanities), with the most offensive being 死ね, equivalent of “Fuck you” with a rating of 4.69 on the offensiveness scale.

Figure 2: Summary of the offensiveness of English profanities and equivalent Japanese abusive language

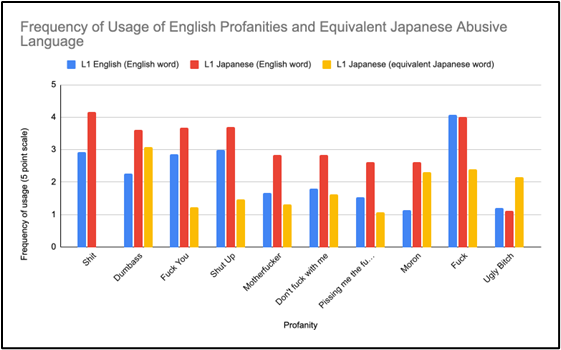
When it comes to frequency of usage, L1 Japanese bilinguals also reported using the English profanities at a higher frequency, with self-reported frequency being 0.87 points higher than their L1 English counterparts. This was the case for almost all English profanities across the board with the exceptions of “Fuck” and “Ugly Bitch” which had near equal usage; the largest differentials were found in “Moron” (difference of 1.48) and “Dumbass” (difference of 1.35). Interestingly, L1 Japanese speakers reported a rather low frequency of usage for the counterpart Japanese abusive language, with an average of 1.85 on the 5 point frequency scale. The most frequently used one being 「バカ」equivalent to “Dumbass” at 3.08, followed farther behind by 「クソ」 equivalent to “Fuck” at 2.38. This reflects the less frequent use of abusive language in Japanese compared to English which uses profanities more freely. This also corroborates the higher offensiveness of Japanese abusive language, which is used more infrequently and thus packs more of a punch.

Figure 3: Summary of the self-reported frequency of usage of English profanities and equivalent Japanese abusive language

Discussion and Conclusion

4.1 Phase 1 Discussion

In Phase 1, we found that L1 Japanese speakers used the same word 「くそ”」 (kuso) as an approximation for both “shit” and “fuck”. While this was not something that we had initially hypothesized, our findings in Phase 1 supported the idea that the Japanese language has less explicit profanities as previously found in research such as Jackson & Kennet (2021), highlighting the semantic overlap in the translation of “shit” and “fuck”, which underscores the limited availability of distinct Japanese terms that capture the unique connotations of these words in English. Similarly, the minimal variability in the translation of “dumbass” and “moron” suggests that Japanese speakers may perceive insults related to intellectual capability as largely interchangeable, pointing to a possible variability from L1 English speakers in how such terms are employed and understood.

4.2 Phase 2 Discussion

In Phase 2, we found that L1 Japanese speakers viewed English profanities as less offensive than L1 English speakers in all but two instances (“Shut Up” and “Fuck”). This aligned with our hypothesis that L1 Japanese speakers would perceive English profanities as being less emotionally charged. However, this contrasted with the findings of the Dewaele (2016) study which found that non-native English speakers would overestimate the offensiveness of English profanities and avoid using them. Our findings, instead, seemed to align more with Gawinkowska et. al (2013) which found that bilingual speakers were actually more inclined to use strong expletives in their L2 because they felt less bound by the norms of their L1. In our study, we saw evidence of this from the higher rates of usage for English profanities by L2 Japanese speakers than L1 English speakers. Japanese L1 speakers also rated the Japanese approximations of English swear words as being higher in offensiveness than the English swear words themselves. In the midst of conflicting research, we found that our findings followed similar patterns to Gawinkowska et. al. This may be due to the deeply ingrained collectivist cultural norms and emphasis on face-saving that exists in Japanese culture (Lin & Yamaguchi 2011) that may make L1 Japanese speakers more sensitive to abusive language in their native tongue.

4.3 Overall Discussion

This study offers some insight into the perceptions of emotional words in an L2. In our case, this refers to the use of profanities that are explicit without context for speakers who are familiar with abusive language that require context to be abusive. Research that helps understand these experiences will hopefully contribute to a wider understanding of interpersonal connection by identifying the ways language can cause miscommunications due to differences in culture as well as the language itself. Interestingly, additional observations suggest that non-English speakers often react with surprise or discomfort when exposed to the meaning of English profanities. In a street interview conducted by Asian Boss (LINK), Japanese people shared that they find such language uncomfortable and showed that abusive words are rarely used in Japanese culture. This observation also occurs among English speakers with Japanese people. According to the discussion in the Podcast “Hapa 英会話 Podcast – 第305回「汚い言葉遣い」”(LINK) , some English speakers try not to use the profanity with Japanese people even when they are talking each other in English. This similarity shows that hesitation from using profanity comes from the differences across cultural backgrounds regarding when it is appropriate to use profane language, which gives insight to the experiences of Second Language Learners as they navigate unfamiliar territories. These reactions further emphasize the cultural and linguistic differences in how profanities are perceived and used between English and Japanese speakers.

While our research was limited to only include college-aged students, future research would ideally expand the scope to include a variety of ages and educational backgrounds. Future research could also compare our findings with Japanese L1 speakers to another L1 language with contrasting conventions of abusive language.

References

Dewaele, J.-M. (2016). Thirty shades of offensiveness: L1 and LX English users’ understanding, perception and self-reported use of negative emotion-laden words. Journal of Pragmatics, 94, 112–127. https://doi.org/10.1016/j.pragma.2016.01.009 

Gawinkowska, M., Paradowski, M. B., & Bilewicz, M. (2013). Second language as an exemptor from sociocultural norms: Emotion related language choice revisited. PLOS ONE, 8(12), e81225. https://doi.org/10.1371/journal.pone.0081225

Hoshino,  Akira  (1971). Akutai  mokutai  kō  –  akutai  no  shosō  to  kinō. [Thoughts  on  Abusive  Language.  Aspects of Abusive Language and its Functions]. Kikan jinruigaku  2(3): 29– 52.

Jackson, L., & Kennett, B. (2021). Slang and taboo language: An analysis of swearing guides for L2 Japanese learners. Electronic Journal of Contemporary Japanese Studies, 21(2). Retrieved from https://japanesestudies.org.uk/ejcjs/vol21/iss2/jackson_kennett.html

Lin, C.-C., & Yamaguchi, S. (2011). Effects of face experience on emotions and self-esteem in Japanese culture. European Journal of Social Psychology, 41(4), 446–455. https://doi.org/10.1002/ejsp.817

Relevant Info: Hapa 英会話 Podcast. (2020).  第305回「汚い言葉遣い」[Podcast]. Retrieved from https://podcasts.apple.com/jp/podcast/hapa%E8%8B%B1%E4%BC%9A%E8%A9%B1-podcast/id814040014?i=1000491739815  Asian Boss. (2018). Japanese React to English Swear Words [YouTube video]. Retrieved from https://www.youtube.com/watch?v=KHpw5p8qCrI&t=61s

[/expander_maker]
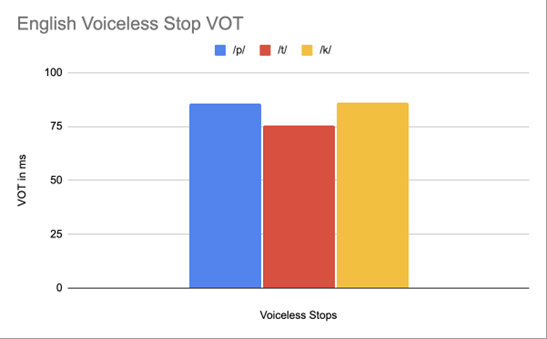
The Effect of Code-Switching on Voice Onset Time (VOT) in Spanish-English Bilinguals

Miroslava Albiter, Caitlin Morlett, Renee Ma, Jaquelin Trujillo, and Zirui(Ray)

Have you ever heard your friend or family speak two languages in one phrase? Have you ever spoken two languages in a sentence? We look deeper into how code-switching affects phonological convergence, specifically in Spanish-English bilinguals. A key phonological difference between English and Spanish is the articulation of word-initial voiceless stops such as /p/, /t/, and /k/. Therefore, we specifically analyzed how the Voiced Time Onset (VOT) measures of Spanish-English bilinguals are affected by code-switching between Spanish and English. Sixteen English-Spanish bilinguals were recorded and asked to read aloud the Rainbow passage, a passage with English sentences, Spanish sentences, and code-switched English-Spanish sentences. PRAAT was used to measure the participants’ VOTs to compare the differences to a baseline VOT measure of monolingual English and Spanish speakers (Castañeda Vicente, 1986; Lisker & Abramson, 1964).

After data collection and analysis, we discovered that both VOTs of English and Spanish were lengthened during code-switching, albeit for different reasons. As Spanish VOT extended due to phonological convergence, English VOT also unexpectedly extended. We observed evidence for hyper-articulation, which can further explain our conclusion. However, limitations are reckoned with, and thus, fields of phonological change within code-switched contexts are explored.

[expander_maker id=”1″ more=”Read more” less=”Read less”]

Introduction and Background

In this article, we investigated code-switching in English-Spanish bilingual college students, focusing on their phonological change along with the process of code-switching through Voice Onset Time. Code-switching “is a practice common among bilinguals whereby speakers use both languages in a single utterance” (Balukas & Koops, 2015). We will analyze whether English-Spanish bilingual college students demonstrate phonological convergence of VOT in code-switching sentences. The age range of the 16 tested participants varies, with 14 being 20 years old and the other two between 40 and 50 years old. After collecting data, we examined the Voice Onset Time (VOT) in different circumstances and the subsequent phonological convergence in English-Spanish code-switched sentences.

According to previous research, English monolingual speakers typically produce a longer VOT of word-initial voiceless stops than Spanish monolingual speakers (Balukas & Koops, 2015). Samples from bilingual participants were collected and analyzed using Praat, with a particular focus on VOT changes and the evidence of subsequent phonological convergence. As such, we are investigating a potential phenomenon wherein the English VOT is observed to shorten while the Spanish VOT lengthens in English-Spanish code-switched sentences. This dynamic interaction may be further interpreted as evidence of phonological convergence, reflecting an underlying adjustment mechanism within bilingual speech production systems. Due to the lack of ready access to true monolingual speakers in the LA area, we will use data from the BYU Scholars Archive to compare the VOT of our bilingual speakers to the average VOT for /p/, /t/, and /k/ in both English and Spanish. In the BYU Scholars Archive, the Spanish baseline was recorded at the University of Barcelona in 1986 and was taken from 10 monolingual Spanish speakers (Castañeda Vicente, 1986). The English baseline in the archive was recorded at the University of Pennsylvania in 1964 based on 4 American monolingual English speakers (Lisker & Abramson, 1964).

Figure 1 – Chart from BYU Scholars Archive showing the average VOT is ms for English bilinguals and Spanish bilinguals

Phonological properties, including VOTs, can be differentiated across various dialects, even within the same language. In this research, our participants predominantly speak LAVS (Los Angeles Vernacular Spanish), while three speak the Castellano dialect.

In this study, we will investigate whether code-switching influences VOT in English-Spanish bilingual speakers. Testing the specific phonological changes in VOTs in English and Spanish during code-switching. It finally aims to detect the phonological convergence during code-switching in English-Spanish bilinguals. Our hypotheses of VOT and phonological convergence are as follows:

  1. English-Spanish bilingual speakers will shorten English VOT and lengthen Spanish VOT compared to true monolingual speakers of each respective language.
  2. If the speaker’s L1 is English and their L2 is Spanish, we expect the VOT for Spanish /p/, /t/, and /k/ to be longer than Spanish monolingual speakers. We also expect their English VOT for /p/, /t/, and /k/ to reflect the VOT of monolingual English speakers.
  3. If the speaker’s L1 is Spanish and their L2 is English, we expect the VOT for English /p/, /t/, and /k/ to be shorter than English monolingual speakers. We would also expect their Spanish VOT for /p/, /t/, and /k/ to reflect the VOT of monolingual Spanish speakers.

If a participant has been discouraged from speaking Spanglish, they will be more likely to have longer VOT in Spanish despite differences in their L1 or L2.

To clarify related concepts, VOT is “the temporal relationship between laryngeal pulsing and the onset of consonant release” (Molfese & Narter, 1997). Phonological convergence, on the other hand, refers to the process by which speakers in a communicative interaction adjust their phonological patterns—such as pronunciation, intonation, or rhythm—towards one another. A key phonological distinction between English and Spanish arises primarily in articulating word-initial voiceless stops, namely /p/, /t/, and /k/. Positive VOT, or aspiration, is characterized by a puff of air following the release of the stop.

A phonological rule of English specifies that word-initial voiceless stops are aspirated or have a positive VOT. Word-initial voiceless stops in Spanish are typically not aspirated or aspirated, much less than English word-initial voiceless stops (Piccinini & Arvaniti, 2015). We will explore Voice Onset Time in code-switching contexts. Code-switching “is a practice common among bilinguals whereby speakers use both languages in a single utterance” (Balukas & Koops, 2015). We will analyze whether English-Spanish bilingual college students demonstrate phonological convergence of VOT in code-switching sentences.

Methods

We will first have all participants complete the demographic and self-report questionnaire about their linguistic background. The questionnaire will include information about their L1 and L2, how often they code-switch, their proficiency in speaking and reading both languages and if they speak any other languages. Lastly, we will include sociocultural questions about their language use, including how positively or negatively they feel about speaking Spanglish and if they have ever been discouraged from speaking Spanglish.

The participants will read “The Rainbow Passage,” a context that includes a mix of English-only sentences, Spanish-only sentences, and sentences that switch from English to Spanish or Spanish to English. We will account for individual idiosyncrasies while striving to derive principles that are as generalizable as possible. The participants will read the following paragraph adapted from the Rainbow Passage with pre-written code-switched sentences:

When the kind sunlight strikes cold raindrops in the air, they act as a prism and form a rainbow. El arcoiris divide la luz blanca en muchos colores hermosos. Estos toman la forma de un arco tan largo, with its path high above, and its two ends apparently beyond the horizon. There is, according to legend, a boiling pot of gold at one end. People look, pero nadie lo encuentra. Cuando un hombre busca algo más allá de su alcance, sus amigos pueden decir que está buscando la olla de oro al final del arcoíris. Throughout the centuries, people have explained the rainbow in various ways. A recording device will be used to record samples of participants using Praat to measure the phonetic output of the individuals and the length of VOT across all conditions. The English words from the Rainbow Passage that we will analyze include kind, cold, two, to, pot, and people. The Spanish words from the Rainbow Passage that we will be analyzing include colores, toman, tan, pero, cuando, and pueden.

Results and Analysis

Several group members contacted qualified bilingual participants and provided access to the prerequisite questionnaire. After collecting basic information about their first language acquisition (FLA) and second language acquisition (SLA) or second language learning (SLL), we distributed the altered Rainbow Passage to participants, ensuring that the recordings of their utterances were clear and suitable for further analysis. We then reviewed all recordings for quality and completeness before forwarding them to those responsible for data analysis. Audio recordings were collected and analyzed using Praat to find the VOT length. The data collected using Praat for each of the 16 participants is grouped into different categories in order to test the following hypotheses.

  1. Average bilingual /p/, /t/, /k/ VOT compared to monolingual /p/, /t/, /k/ VOT (BYU)
  2. Group English L1 speakers /p/, /t/, /k/ VOT and compare to Spanish L1 speakers /p/, /t/, /k/ VOT
  3. The average /p/, /t/, and /k/ VOT for both languages was based on whether or not they were discouraged from speaking Spanglish.

Based on our data grouping, we discovered that our first hypothesis was false because the English VOT mean values for all 16 of our participants (/p/ 85 ms) (/t/ 75 ms) (/k/ 86 ms) were longer than our baseline measurements. Our Spanish voiceless stop mean values based on 16 participants (/p/ 22 ms) (/t/ 75 ms) (/k/ 27 ms) had a /p/ and /t/ value that was longer than the baseline measures, but the /k/ mean was similar to the baseline data.

Figures 2 and 3—The graph shows the mean VOT in milliseconds for all 16 participants. Figure 2 displays the English VOT values for /p/ (blue), /t/ (red), and /k/ (yellow). Figure 3 shows the Spanish VOT values for /p/ (blue), /t/ (red), and /k/ (yellow). 

We found our second hypothesis partially correct because our Spanish VOT was longer than the baseline data, but our English VOT was also longer than the English baseline. Our English L1 Spanish Voiceless mean VOT values (/p/ 28 ms) (/t/ 22 ms) (/k/ 72 ms) were longer than the VOT baseline data collected from Spanish monolinguals. Our English L1 English mean VOT values were similarly longer than those of English monolingual speakers in the baseline data.

Figures 4 and 5 – The graph shows the mean VOT in milliseconds for all participants with English as their first language. Figure 4 shows the English VOT values for /p/ (blue), /t/ (red), and /k/ (yellow). Figure 5 shows the Spanish VOT values for /p/ (blue), /t/ (red), and /k/ (yellow).

We discovered that our Spanish VOT was longer than our baseline for the /k/ voiceless stop, partially supporting our third hypothesis. Our Spanish L1 English mean VOT (/p/ 51 ms), (/t/ 63 ms), (/k/ 72 ms) was shorter than our baseline, as expected. When we looked at our Spanish L1 Spanish, mean VOT (/p/ 18 ms), (/t/ 18 ms), and (/k/ 27 ms), we discovered that the /p/ and /t/ mean VOT values were longer than the baseline, while the /k/ mean VOT value was identical to the baseline value.

Figures 6 and 7 – The graph shows the English VOT values for /p/ (blue), /t/ (red), and /k/ (yellow). Figures 6 and 7 show the mean VOT in milliseconds for all participants whose first language was Spanish. The Spanish VOT values for /p/ (blue), /t/ (red), and /k/ (yellow) are shown in Figure 6.

Since the participants who were discouraged from speaking Spanish had a lower VOT than those who were encouraged to speak Spanish, our fourth hypothesis was false. In comparison to our encouraged Spanish mean VOT, which is (/p/ 24 ms) (/t/ 24 ms) (/k/ 28 ms), our discouraged Spanish mean VOT was (/p/ 18 ms) (/t/ 18 ms) (/k/ 28 ms).

Figures 8 and 9—The graph shows the average VOT in milliseconds for each of the 16 participants according to whether they had been encouraged to speak Spanglish. The mean VOT in ms for the /p/, /t/, and /k/ values for the participants who received encouragement is displayed in Figure 8. The mean VOT in ms for the discouraged participants’/p/, /t/, and /k/ values are displayed in Figure 9.

Figures 10 and 11 – Both are screenshots of the Praat spectrograms of one of our participants. The VOT of the participant who produced the [t] in the word “toman” is displayed in red in Figure 10 (left). The VOT of the participant who produced the [tʰ] in the word “to” is displayed in red in Figure 11 (right). Speaking Spanglish has been discouraged for this individual, whose first language is Spanish.

Figures 12 and 13 –  Both are screenshots of the Praat spectrograms of one of our participants. The VOT of the participant who produced the [p] in the word “pero” is displayed in red in Figure 12 (left). The VOT of the participant who produced the [pʰ] in the word “people” is displayed in red in Figure 13 (right). Speaking Spanglish has been discouraged for this individual, whose first language is Spanish.

Figures 14 and 15 –  Both are screenshots of the Praat spectrograms of one of our participants. The VOT of the person who produced the [k] in the word “colores” is displayed in red in Figure 14 (left). The VOT of the person who produced the [kʰ] in the word “kind” is displayed in red in Figure 15 (right). Speaking Spanglish has been discouraged for this individual, whose first language is Spanish.

Discussion and Conclusion

This research aims to contribute to understanding phonetic changes during code-switching, focusing on the syllables /p/, /t/, and /k/. The findings indicate that, in addition to phonological changes influenced by language-specific properties, hyper-articulation during the experimental process can also impact the results. Notably, the VOTs of both English and Spanish were lengthened, albeit for different reasons. While previous studies suggested that English VOT should remain stable, the observed lengthening may be attributed to hyper-articulation. This phenomenon occurs when participants consciously articulate more clearly to facilitate phonetic analysis, particularly when instructed to produce distinct utterances for experimental recording. The results aligned with some of our hypotheses, though some biases were observed. Further analysis is required to identify academically sound explanations for these findings.

Due to the difference in language properties, the Spanish VOT is lengthened as predicted. Spanish generally exhibits shorter VOT than English. During code-switching between English and Spanish, the VOT of Spanish syllables was observed to be longer than that of monolingual Spanish speakers, suggesting the occurrence of phonological convergence. However, the lengthened English VOT needed to be accounted for in the hypotheses regarding phonological convergence, necessitating further exploration for alternative explanations.

Based on one of our references (Kasia Muldner,2017), English VOT during code-switching is nearly identical to monolingual speakers, which can be attributed to differences in language-specific characteristics. Consequently, English undergoes minimal phonological changes during code-switching. Our hypotheses align with previous studies, suggesting that despite minor variations, English VOT remains nearly identical to that of monolingual English speakers. However, this experiment’s data showed opposite conclusions, forging us to discover more reliable explanations.

Overall, all VOT measures, except for the Spanish /k/, did not reflect our true monolingual English and Spanish speakers. Baseline data demonstrated an increase in VOT data as the place of articulation was placed further back in the vocal cavity. The /p/ VOT was the shortest, next was /t/ VOT, and the longest was the /k/ VOT in both English and Spanish. Our participants produced a similar VOT for all the English stops (around 80 ms) and all Spanish stops (around 23 ms) These findings suggest that bilingual speakers may default to one length of VOT regardless of the place of articulation, whereas monolingual speakers produce a different VOT length for each stop consonant. Despite previous research, this provides evidence that bilinguals differ in VOT production from monolinguals. 

Another interesting finding was hyper-articulation in our sample, which was characterized by more distinct and easily recognizable pronunciations. This phenomenon is hypothesized to have occurred because participants were instructed to produce clear recordings for subsequent analysis using professional phonetic tools (PRAAT), inadvertently creating a more demanding articulatory environment. Moreover, when comparing English in code-switched contexts with that of monolingual speakers, it is important to consider the inherent variations within English itself. Due to its diverse dialects and accents and a long history of linguistic contact, the definition of  ‘standard’ English is ambiguous. This suggests that the participants in our study may have exhibited different English accents from the outset, potentially influencing the results of our experiment.

Our study encountered a few limitations that affected the study’s results. Firstly, it is a vital variation given that our demographic was relatively small (16 people, with 14 college students), which may produce bias. Furthermore, all of them are self-reported bilinguals, even though with a linguistic background questionnaire, the clarification of “bilingual” remained unclear and contained various things. Our linguistic background questionnaire cannot showcase the diversity and dynamic of bilinguals panoramically and thus may ignore some related variations in code-switching. Secondly, though being collected and quantitatively analyzed, the data per se remained unclear in its accuracy in spontaneous code-switching in natural utterances. Taken together, this research contributes to the research looking into the relationship between code-switching and phonological convergence in Spanish-English bilinguals. The observed VOT lengthening during code-switching contexts suggests a dynamic interaction between languages where bilingual transfer does not have a bidirectional relationship. Bilingual speakers may also adjust their articulation based on the contextual demands of the linguistic environment. Future studies could further explore the implications of phonological transfer and its potential effects on language production in bilinguals.

Appendix I: Linguistic background questionnaire[1] [2] 

(1)  Is English your L1 or L2?

(2) Is Spanish your L1 or L2?

(3) Can you read and speak Spanish?

(4) Can you read and speak English?

(5) Do you speak any other language other than English and Spanish?

(if yes, which languages?)

(6) On a scale from 1-10, how often would you say you code-switch between English and Spanish? (Code-switching is the act of alternating between two or more languages or dialects within a conversation or phrase.)

(7) How positively or negatively do you feel about speaking Spanglish?

(8) Have you ever felt discouraged from speaking Spanglish?

  • yes
  • no

Appendix II: The Rainbow Passage in English and Spanish

When the kind sunlight strikes cold raindrops in the air, they act as a prism and form a rainbow. El arcoiris divide la luz blanca en muchos colores hermosos. Estos toman la forma de un arco tan largo, with its path high above and its two ends apparently beyond the horizon. There is, according to legend, a boiling pot of gold at one end. People look, pero nadie lo encuentra. Cuando un hombre busca algo más allá de su alcance, sus amigos pueden decir que está buscando la olla de oro al final del arcoíris. Throughout the centuries, people have explained the rainbow in various ways.

References:

Balukas, C., & Koops, C. (2015). Spanish-English bilingual voice onset time in spontaneous code-switching. International Journal of Bilingualism, 19(4), 423-443. https://doi.org/10.1177/1367006913516035

Banov, I. K. (2014, December 1). The production of voice onset time in voiceless stops by … BYU ScholarsArchive. https://scholarsarchive.byu.edu/cgi/viewcontent.cgi?article=5339&context=etd

Castañeda Vicente, M. L. (1986). El V.O.T de las oclusivas sordas y sonoras españolas. Estudios de fonética experimental, 2, 91-110.

Kasia Muldner, Leah Hoiting, Leyna Sanger, Lev Blumenfeld and Ida Toivonen.The phonetics of code-switched vowels, Carleton University, Canada https://journals.sagepub.com/doi/10.1177/1367006917709093

Lisker, L., & Abramson, A. S. (1964). A Cross-Language Study of Voicing in Initial Stops: Acoustical Measurements. WORD, 20(3), 384–422. https://doi.org/10.1080/00437956.1964.11659830

Ojeda, Adriana, Ana De Prada Pérez, and Ratree Wayland. Heritage Speakers and their Language Use: A Phonetic Approach to Code-Switching. University of Florida.

Olson, D. J. (2016). The role of code-switching and language context in bilingual phonetic transfer. Journal of the International Phonetic Association, 46(3), 263–285. https://www.jstor.org/stable/26352311

Piccinini, P., & Arvaniti, A. (2015). Voice onset time in Spanish–English spontaneous code-switching. Journal of Phonetics, 52(Sep), 121–137. https://doi.org/10.1016/j.wocn.2015.07.004 Voice onset time. (n.d.). ScienceDirect. Retrieved November 18, 2024, from https://www.sciencedirect.com/topics/biochemistry-genetics-and-molecular-biology/voice-onset-time

[/expander_maker]
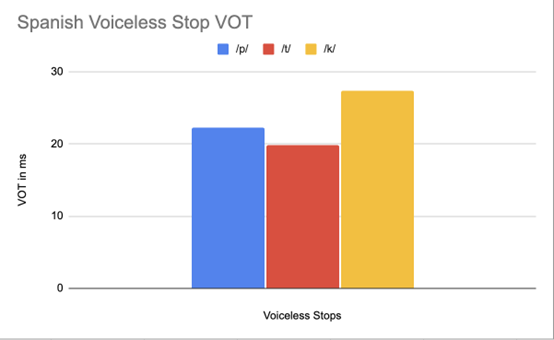
The Language of Love: Gendered Communication Patterns in Conflict

Analisa Sack, Paden Frye, Olivia Simons, Stella Kang, Jeorgette Cuellar

Our study explores the differences in how men and women express emotions in heterosexual relationships, particularly during conflict situations. The research investigates language dynamics among college-aged couples. Hypothetical conflict scenarios were used to elicit natural responses, which we then transcribed and analyzed. The findings reveal that women are more likely to use emotive language, engage in expressive communication, and employ collaborative discourse strategies during conflicts. In contrast, men tend to use direct communication styles, focusing on factual components and solution-oriented language. These results align with existing research on gendered communication patterns, supporting the hypothesis that media portrayals of emotional women and logical men have a basis in reality. This study underscores the importance of understanding gender-specific communication styles, offering insights that can enhance relationship counseling and educational programs. Future research directions include cross-cultural studies and longitudinal analyses to further explore these dynamics. The implications of this research are significant for developing tailored communication strategies in both personal and professional contexts.

[expander_maker id=”1″ more=”Read more” less=”Read less”]

Introduction and Background

We aim to investigate language dynamics and patterns within college-aged heterosexual relationships. With a specific focus on conversation, conflict, and conflict resolution. Communication styles in relationships affect conflict resolution and relational satisfaction. Prior studies have shown differences in male and female communication styles, but specific lexical patterns and their impact on conflict resolution are underexplored. We chose college-aged heterosexual relationships because this age group is shown to be especially important as shown in a study done by Sprecher (1993); typically, we see this age undergoing key developmental transitions and experiencing many situations that may be emotionally or relationally challenging. This study will analyze lexical patterns in conversations to understand gender dynamics in conflict resolution. We hypothesize that during conflict in heterosexual relationships, women are more likely than men to use emotive language, engage in expressive communication, and employ collaborative discourse strategies during conflict resolution, whereas men are more likely to use direct and assertive communication styles, focusing more on factual components of the situation and solution-oriented terms of speech.

Regarding social structures within college-aged relationships, previous research has suggested women are more emotionally active in relationships, but little applicable research has actually shown this. While women have expressed the consistency in emotions experienced being high, their expression of these emotions isn’t necessarily higher than that of men. Our study aimed to understand how men and women approach conflict resolution by looking at word choice and language use in particular (conversation analysis), evaluating how men and women use language differently to approach conflict. The language aspect we are examining is word choice (lexicon) and interaction patterns (conversation analysis) – more specifically, the use or lack of emotive language and expressive communication (Rogers, Ha, Byon, & Thomas, 2020, p. 112).

Methods

In order to collect relevant results, we thought it would be best to observe couples resolving a “natural” conflict. Since it would be nearly impossible to follow a couple around and wait for them to have a fight, we thought our best option would be to simulate a conflict and ask the couple to react to each other the way they would in real life. We understand and acknowledge that this might present flaws in our data due to self-reporting bias, where people tend to try making themselves seem “better” than they are in reality. Nevertheless, these are the hypothetical situations we presented:

  1. The first hypothetical (where the female partner is upset) is the following: “You are upset because last night you were trying to get ready for scheduled plans, but you felt rushed by the tasks that needed to be done before you left (go grocery shopping, cook dinner, wash dishes, etc..). You did several tasks alone while your partner sat on the couch and watched TV; he was aware that you were working hard and rushing because you needed to be somewhere, yet he didn’t help. You are trying to express that you feel abandoned because he wasn’t trying to help you.”
  2. The second hypothetical (where the male partner is upset) is the following: “You are upset because your partner was out late at a girls’ night and was being unresponsive to you. You knew that she would be out late; however, she didn’t text you the entire night, ignored your phone calls, and didn’t call back until she finally got home. She apologized, but made excuses about just ‘forgetting.’ You are trying to express that you feel ignored and hurt because she didn’t consider how you would feel about her silence.”

After we conducted the interviews, we analyzed the transcripts by deciding on five categories that best summed up the strategies the two participants used. These categories included justifications, connecting the argument to larger issues in the relationship, involving emotions, using logical approaches, and apologizing. We decided on a standardized way to tag parts of the dialogue with each strategy and then counted each instance of each strategy for both partners in both hypotheticals. We then created pie charts to visualize our data for both partners in both hypotheticals.

Results and Analysis

The most common strategy used by the female partner was connecting the argument to larger issues in the relationship, followed by justifications and involving emotions. For the male partner, justifications came first, followed by using a logical approach and apologizing.

After conducting controlled experiments with the implementation of two separate hypothetical situations to heterosexual college couples, it was observed that male partners exercise direct response tactics more often than females and utilize logical reasoning along with factual references in order to strengthen their argument, while also digressing at moments in order to avoid further conflict or off-track arguments. Previous studies have hypothesized that a woman’s willingness to exceed only factual comments in arguments is due to their lack of power or control in the outside world and their desire to hold more control in intimate spaces.

Figure 1. Results from each hypothetical separated by strategy category.

Female partners tended to use open questions and emotive language very often, expressing their feelings. Although initial questions were presented when initiating conflict resolution strategies, there were never any direct solutions posed by the female partner. Female participants also expressed a wider range of emotions, including anger, sadness, confusion, and disbelief during the conversation. Vocally, our female participant also had more shifts in tone – explicitly in words used – and differences in pitch depending on the emotions she felt at the moment. The female participant also related current conflict with previous situations where her feelings and overall well-being were disregarded, and she was forced into performing more emotionally/physically labor to make up for her partner’s negligence.

Our findings were in line with the article “Gender Differences in Perceptions of Emotionality” by Susan Sprecher used as background for the study, specifically with the idea that men will not argue as emotionally or as long as women do and tend to discuss conflicting topics without extreme emotion. We hypothesized these would be our result but ultimately gained a better understanding of the psychodynamic difference of the male versus female resolution strategy through the article’s in-depth observations.

Discussion and Conclusions

In conclusion, our hypothesis was supported by the findings of our study. We observed differences in communication during conflict resolution within heterosexual relationships. Women were more inclined to use more emotive language, characterized by a higher frequency of elements such as tag questions. This aligns with Robin Lakoff’s observations in “Language and Woman’s Place,” where tag questions – phrases like “isn’t it?” or “right?” added to the end of statements – serve to invite confirmation or agreement, thereby fostering a more inclusive and collaborative dialogue (Lakoff 54). In our research, women used tag questions seven times compared to men’s two instances. For example, in Hypothetical 1, a woman asked, “Do you trust me or my friend’s stories?” (F, 02:18), illustrating the use of tag questions to engage the listener. Conversely, men demonstrated a tendency toward a more direct communication style, often employing justifications. This logical approach focuses on explaining actions or decisions assertively. For instance, in Hypothetical 2, a man stated: “You usually just want to do stuff your own way because if I do something my way, you don’t like the way it’s done” (M, 00:49). This directness reflects a more frequent use of logical elements in his communication, aimed at justifying perspectives or actions.

Further, our results are in alignment with studies done about typical communication style differences in gender. In the article “Gender Issues: Communication Differences in Interpersonal Relationships” from Ohio State University, we learn that society has a general understanding of women having to ‘read between the lines’ in relationships: “Studies indicate that women, to a greater extent than men, are sensitive to the interpersonal meanings that lie ‘between the lines’ in the messages they exchange with their mates. That is, societal expectations often make women responsible for regulating intimacy, or how close they allow others to come” (Torppa). As we concluded from our own research, it appears that women are more inclined to connect a specific argument to the larger scope of the relationship. When something brought up in conflict triggers a larger, recurring issue, the female partner is likely to open up the conversation to what she can see by ‘reading between the lines.’

According to research done by Jessica Cindaro regarding male and female differences in communicating conflict, prior literature suggests a tendency for women to be more emotive in their communication styles, while men tend to be more direct and assertive, using emotions less. Cindaro explains that this is in part because of gender stereotypes and the environment in which men and women are raised in and the messages they receive growing up about how best to communicate (Cindaro). We see in our results that there is an even distribution involving emotions, but that the male partner takes more of a logical approach more often than the female partner.

These findings underscore the distinct communication styles of men and women, and such insights can be valuable in enhancing communication strategies across various contexts, from personal relationships to professional interactions. Also, by providing deeper insights into how communication styles differ between genders, our findings can inform relationship counseling and therapy practices, allowing therapists to develop more effective strategies that are tailored to each gender. This improved understanding can contribute to better communication and conflict resolution within relationships, ultimately supporting potentially healthier interpersonal dynamics.

In the future, our research aims to open avenues for expanding the scope of study. One possible direction is conducting cross-cultural studies to investigate whether the communication patterns we observed are consistent across different cultural contexts or if they vary significantly. This would provide a broader understanding of how cultural influences shape gender communication styles. Additionally, we could undertake longitudinal studies to track how communication styles and conflict resolution strategies evolve over time within relationships. These long-term studies can offer deeper insights into the dynamics of long-term relationships, shedding light on how communication evolves and how couples adapt their conflict resolution strategies over the years.

Another question that might be brought up in relation to our study is one of media’s influence on a person’s gender identity. In the TED Talk “Secrets of Children’s Media: Effects of Gender Stereotypes,” Rifa Momin reveals that children are influenced by the stereotypes they continuously hear as they grow up. From children’s television to storybooks, the power of media influence contributes to “children developing a sense of maleness and femaleness based off of these stereotypes and organiz[ing] their behaviors around them” (Momin). This presents a bigger question about our research: Do the stereotypes we perceive men and women to inhabit originate from their media intake? If children were not exposed to media that perpetuates gender stereotypes, would they grow up to act differently than the way society has led us to believe we’re ‘inclined’ to act?

Overall, the study we have conducted opens a wide variety of discussion topics regarding gender stereotypes, communication styles, and conflict within heterosexual college-aged relationships. While our study is not reflective of every single relationship out there, we hope we accomplished our goal of sparking conversation to further understanding about why men and women communicate differently.


References    

Cinardo, J,  (2011) Male and Female Differences in Communicating Conflict. Honors Theses. 88. https://digitalcommons.coastal.edu/honors-theses/88.

Lakoff, R. (1973). Stanford. Language and Woman’s Place. https://web.stanford.edu/class/linguist156/Lakoff_1973.pdf.

Momin, R. (2022, March). Secrets of children’s media: Effects of gender stereotypes. Rifa Momin: Secrets of Children’s Media: Effects of Gender Stereotypes | TED Talk. https://www.ted.com/talks/rifa_momin_secrets_of_children_s_media_effects_of_gender_stereotypes?language=en.

Rogers, A. A., Ha, T., Byon, J., & Thomas, C. (2020). Masculine gender‐role adherence indicates conflict resolution patterns in heterosexual adolescent couples: A dyadic, observational study. Journal of Adolescence, 79(1), 112–121. https://doi.org/10.1016/j.adolescence.2020.01.004.

Sprecher, Susan. Sexuality. SAGE Publications Inc., 1993.

Sprecher, S., & Sedikides, C. (2019, August 14). Gender differences in perceptions of emotionality: The case of close heterosexual relationships – sex roles. SpringerLink. https://link.springer.com/article/10.1007/BF00289678.

Torppa, C. B. (2010, February 25). Gender issues: Communication differences in interpersonal relationships. Ohioline. https://ohioline.osu.edu/factsheet/FLM-FS-4-02-R10.

[/expander_maker]
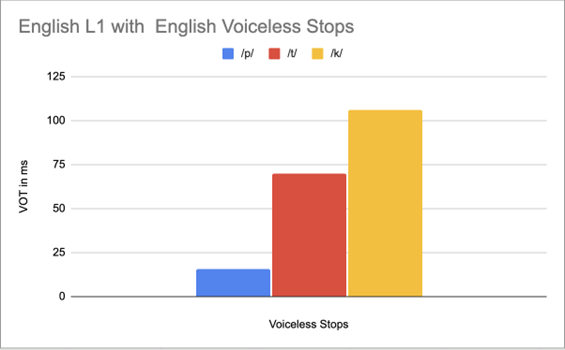
, , , , ,

I’m Sorry! – The Language Behind YouTube Apologies and Cancel Culture

Jessica Chen, Jean Maynard, Naomi Muñoz, Daisy Terriquez

“I’m sorry, I’m taking accountability” is a phrase that may sound familiar to those who frequent the internet. This is referencing the category of YouTube videos known as the “apology video,” where, as the name suggests, influencers post videos of themselves apologizing for actions that caused them to be “canceled.” In this blog, we examine if these apology videos share any patterns in their word choice and behavioral manners and if certain key words and phrases contained in these videos have become recognizable to audiences and associated with this style of video. This study was conducted in two parts: (1) analyzing 10 different apology videos posted to YouTube to map the commonalities found in word choice and gestures and (2) a two-part survey to deduce if participants could identify apology videos based solely on a provided comment or phrase. With this entry, we hope our findings can further the understanding of internet language, as well as promote conversations of media literacy, social advocacy, and mental health surrounding internet spaces.

[expander_maker id=”1″ more=”Read more” less=”Read less”]

Introduction and Background

With the globalization of technology, the ability to connect with a broad audience and build a large following has become readily attainable. Today social media platforms such as TikTok, YouTube, Twitter/X, and Instagram have facilitated the emergence of “influencers,” individuals who regularly post content on the internet and have managed to captivate a large following by sharing their daily lives, opinions, and thoughts. However, with such a large social media presence comes an increased possibility of every one of one’s actions being perceived and criticized by individuals who do not share similar morals or values. Consequently, it has become quite common to open social media apps to see yet another influencer on camera sighing and apologizing for an alleged act of misdemeanor they are being framed with. Essentially, this has made the online “celebrity apology” become so common; it has given rise to “cancel culture” and with it, the “YouTuber apology” category of videos.

The concept of “cancel culture” first emerged in the early 2010s and gained significant traction in the mid to late 2010s. Across social media platforms, “cancel culture” is defined as the practice where numerous people express their disapproval and withdraw support from a particular individual or brand (Roos, 2020). It encourages current supporters to “flock away” from influencers who have engaged in actions that are not deemed socially acceptable (Lewis & Christin, 2021). Cancel culture originated on Twitter/X with the intent to bring awareness and accountability to celebrities who have committed social injustices, dating back to movements like #MeToo, but has since been colloquially used to refer to the mass bullying and harassment of creators (Roos, 2020).

Cancel culture, with its “canceled” celebrities, gave rise to the category of videos on YouTube known as the “Youtuber Apology Video.” This is when a content creator records and posts a video of themselves apologizing, expressing their remorse for their misconduct, and asking their audience for forgiveness (Karlsson, 2020). As content creation is a livelihood for many of these influencers, losing monetary support due to overwhelming criticism can be a source of emotional and financial distress, motivating these influencers to release an apology video in an attempt to repair their public image (Goanta & Ranchordás, 2019).

Influencer James Charles via YouTube (Reuploaded).


Influencer Colleen Ballinger via YouTube.

Interestingly, although the reason behind each of these videos may differ, there is reason to believe that many of them contain similar content. In their study analyzing various public celebrity apologies, Cerulo and Ruane (2014) found patterns of apology techniques that many celebrities employed in their statements. This looked like 27% of celebrity apologies containing “evasion” statements where they avoid responsibility, 29% of apologies having “action-ownership” statements where they acknowledge an action, and 32% having “mortification” statements in which the celebrity acts mortified by their own actions (p. 130-135). Though this study predates the rise of many famous YouTube apologies, it suggests a possible pattern that past celebrity apologies may have formed, which proved to be a useful foundation for our research. Although we did not utilize the same categories as Cerulo and Ruane (2014) and opted to find our own keywords, our research aimed to expand on what patterns, if any, could be found in this new form of celebrity image repair.

While research on “cancel culture” exists, our study attempts to address the research gap on both the precise language employed by YouTube content creators’ apologies, as well as how the individual viewers react to and process the content found within these videos. We believe that most research has not addressed the possible relationship between language used by the influencer and how the viewer interacts with it. This research will thus focus on the language used in influencers’ apology videos when they are being “canceled” by the general public. With a focus on Generation Z (Gen Z) and Millennials, the two generations who grew up with technology as an integral part of their daily lives (Serbanescu, 2022), the two research questions that arise are the following: First, can Gen Z and Millennial individuals tell whether an influencer is being canceled solely based on the language being used? Second, does an influencer change their speech patterns or behavioral gestures when they are being canceled? Our aim was to compare the reactions of Gen Z and millennial individuals to language and behavioral gestures used by an influencer when they are being canceled versus when they are in good standing. We hypothesize that when an influencer is aware that they are being canceled, they will engage in specific behavior and speech patterns. Further, we hypothesize that Gen Z and Millennial individuals will be able to tell without context when an individual is being canceled simply by reading comments or quotes with keywords associated with cancel culture.

Methods

To capture commonalities among influencer apologies, we started by compiling 10 YouTube apology videos, all involving YouTube creators who had amassed at least one million subscribers at the point they were canceled (See Image A).

Image A. (left to right) David Dobrik, Logan Paul, Colleen Ballinger, Shane Dawson, Tana Mongeau, PewDiePie, Jake Paul, Jeffree Star, Olivia Jade, James Charles.

Even before this, we started by coding James Charles’ apology video titled “tati” and looked out for words and gestures that were constantly repeated. Based off that initial coding, we created a data chart with eight different keywords (“excuses,” “mistake,” “accountability,” “sorry,” “apologizing,” “um,” “disappointed,” and “idiot”) and four gestures (sighs, gulps, long pauses, and deep breaths) and continued meticulously examining and coding each video to pull out every instance of any of the keywords or gestures. In other words, each video received a tally of how many times these phrases or gestures appeared in the video. Gestures such as sighs and gulps, deep breaths, and long pauses were important in order to grasp an idea about the important factors, other than utterances, that can act as non-verbal communication methods and accompany the keywords to further emphasize the presence of “cancel culture.” Due to the important existence of gestures, we also operationalized “disappointment” as when an influencer simultaneously looks downwards and squints their eyebrows.

To continue our data collection, we created Survey 1, a survey that tests whether or not people know which influencer is being “canceled” based on comments from their YouTube videos (See Image B). With four survey questions in total, two contained comments from normal videos, while the other two contained comments from apology videos. These comments were chosen specifically from James Charles’ YouTube videos, as he was the initial focus for this research; however, future studies should expand to other influencers’ comments to have more variety. The comments were selected randomly, but we intentionally searched for comments that seemed more positive, had humor, and contained little context. This survey was largely utilized to supplement the overall definition of “cancel culture” by assessing Gen Z and Millennials’ topical understanding of it.

Furthermore, another survey, known as Survey 2, was created with the same test; however, it was based on utterances from both apology and normal videos of the influencers (See Image C). Among the several questions that were given in this survey, we deliberately crafted a suitable set of utterances from apology videos that involved our specific keywords to test if people associate those keywords with “cancel culture,” making it one of the most crucial parts of our data collection. By extracting quantitative data from the YouTuber apology videos and surveys, we were able to analyze what specific words and linguistic styles Gen Z and Millennial individuals deem to be associated with apologies and “cancel culture.”   

Image B. Title of Survey 1.


Image C. Title of Survey 2.

Results and Analysis

We can start by examining the data table that quantifies specific keywords uttered in the 10 apology videos and non-verbal communication methods that supplemented those keywords (see Table 1). 

Table 1. Data table with tallies of key words and gestures from each video.

Table 1 displays the heavy use of “sorry” and “apologizing” in all of the apology videos, as well as the common effort to include mentions of “accountability” and making “mistakes.” Some YouTubers occasionally described themselves as feeling “disappointed” in themselves or feeling like an “idiot.” Most importantly, it was extremely common for them to use the word “excuses” in their apology videos. As for gestures, long pauses (with occasional tears) were the most frequent and seemed to dramatize the keywords.

Moreover, four graphs were created to illustrate the results of Survey 1, and eight graphs were made for Survey 2. Among our 55 Gen Z and Millennial survey takers, we gauged the amount of those who felt confident in their ability to tell if an influencer is actively being “canceled,” to which most replied they were somewhat confident (See Tables 2a and 3a).

Table 2a. Survey responses to question at top of graph.


Table 3a. Survey responses to question at top of graph.

Table 2b exhibits the quantified survey results from Survey 1 that involve two comments from when an influencer was actively being “canceled” and two comments from when they were not. For Comment #1, answers were roughly split; however, there were fewer individuals who could determine that the influencer was actually actively being “canceled.” For Comment #2, #3, and #4, most individuals were able to determine the existence of “cancel culture.”

Table 2b. Results from Survey 1 on comments.

Subsequently, Tables 3b and 3c display results for Survey 2, specifically for utterances derived from our chosen apology videos and that contain our significant keywords. Individuals were more likely to be correct and be able to tell that an influencer was actively being canceled; however, Table 3c illustrates that more than half of the survey respondents were unable to determine whether an influencer was actively being “canceled” based on the keyword “um.” Individuals were also more likely to be correct when determining a normal utterance where there were no keywords present (see Table 3d).

Table 3b. Results from Survey 2 on “canceled” utterances.


Table 3c. Results for “um” in Survey 2.


Table 3d. Results from Survey 2 on normal speech from YouTube videos.

Discussion

The current investigation attempts to fill these major gaps within the research by examining cancel culture from a linguistic perspective. Data gathered from YouTube suggests that the comments left on videos where an influencer is being canceled tend to be harsh and demeaning, aiming to publicly shame and bully the creator. The negative language used in the comment section appears to prompt the creator to upload a YouTube video where their language appears to be apologetic, while their behaviors simultaneously portray disappointment and shame in themselves. Since an influencer is aware that they are being canceled, they resort to the use of language that has proven to be effective when crafting an apology.

The findings from this investigation indicate that, in what appears to be an act of desperation to put an end to negative comments and find themselves in good standing with the YouTube community, influencers often resort to the use of the keywords discussed above. Their language quickly shifts from casual everyday language to words that show that they deeply regret their actions and are willing to take accountability.

In Survey 1 (See Table 2b, #1), a comment without context was purposefully chosen in order to test what most respondents think about “cancel culture” comments off the bat. Without context, it is difficult to tell what a comment is specifically referring to. Therefore, our results suggest that there are differences in how individuals view internet language, and it in turn influences whether they think an influencer is being “canceled” or not. In other words, because Comment #1 had no negative keywords and Comment #4 did (“struggling”), it hints that people associated the negative word with “cancel culture,” and therefore, “cancel culture” has this negative linguistic connotation to it. It is also important to note context in our Survey 2 results. When choosing utterances for our survey (See Tables 3b and 3d), we intentionally included utterances about breakfast, trips, sponsorships, and makeup routines, all contexts that are far from the idea of “cancel culture” and negative linguistic aspects. The context completely juxtaposes the utterances from apology videos (See Table 3b) because they are missing the “cancel culture” keywords. A very important finding in Table 3c suggests the importance of those negative associations. In this example, the apology video utterances are more ambiguous than others, especially with the inclusion of “um.” We include the keyword “um” because although it is an extremely common human utterance, it acts as a neutral keyword and requires more context. Most people responded with “Not being canceled,” suggesting that due to the absence of an explicitly negative keyword, respondents were not naturally drawn to viewing it as an apology video utterance.

Previous studies have primarily focused on exploring the psychological effects that cancel culture has on the individual that is actively being canceled. Such studies suggest that while cancel culture originated with good intentions — to hold individuals accountable for socially unacceptable actions — the psychological effects of cancel culture are oftentimes negative and include: social isolation and loneliness, depression, low self-esteem, and constant fear and anxiety (Berryman & Kavka, 2018). Although these findings add to the existing body of research, they also highlight gaps and consequently lead to further research questions: Why does cancel culture lead to these negative psychological states of mind? Does language play a role in cancel culture? Can cancel culture be viewed from another point of view?

Essentially, examining cancel culture from a linguistic perspective adds to the existing research because these findings can be tied back to a psychological perspective and begin to answer these questions. Understanding that the language associated with cancel culture is oftentimes negative and harsh, instead of critical and constructive, allows us to understand why the influencers who are exposed to cancel culture are negatively impacted psychologically. Looking at cancel culture from different lenses can lead us to discovering new findings, but considering the importance of language to our everyday lives, a linguistic analysis is an effective way to begin.


References

Berryman, R., & Kavka, M. (2018). Crying on YouTube: Vlogs, self-exposure and the productivity of negative affect. Convergence, 24(1), 85-98. https://doi.org/10.1177/1354856517736981.

Cerulo, K. A., & Ruane, J. M. (2014). Apologies of the Rich and Famous: Cultural, Cognitive, and Social Explanations of Why We Care and Why We Forgive. Social Psychology Quarterly, 77(2), 123-149. https://doi.org/10.1177/0190272514530412.

Goanta, C., & Ranchordás, S. (Eds.) (2019). The Regulation of Social Media Influencers. Edward Elgar Publishing. Elgar Law, Technology and Society series. http://dx.doi.org/10.2139/ssrn.3457197.

Karlsson, G. (2020). The YouTube Apology; Analysing the image repair strategies and emotional labour of saying sorry online. Malmö University, School of Arts & Communication K3. https://www.diva-portal.org/smash/get/diva2:1483089/FULLTEXT01.pdf.

Lewis, R., & Christin, A. (2022). Platform drama: “Cancel culture,” celebrity, and the struggle for accountability on YouTube. New Media & Society, 24(7), 1632–1656. https://doi.org/10.1177/14614448221099235.

Roos, H. (2020). With(Stan)ding Cancel Culture: Stan Twitter and Reactionary Fandoms. Muhlenberg College. https://jstor.org/stable/community.31638145.

Serbanescu, A. (2022). Millennials and Gen Z in the Era of Social Media. In A. Atay & M. Z. Ashlock (Eds.), Social Media, Technology, and New Generations: Digital Millennial Generation and Generation Z (pp. 61-77). Lexington Books.

All Videos Used for Analysis

Ballinger, C. [Colleen Vlogs]. (2023, June 28). hi. [Video]. YouTube. https://www.youtube.com/watch?v=ceKMnyMYIMo.

Dawson, S. (2020, June 26). Taking Accountability [Video]. YouTube. https://www.youtube.com/watch?v=ardRp2x0D_E.

Dobrik, D. (2021, March 22). 03/22/21 [Video]. YouTube. https://www.youtube.com/watch?v=lB734hc89x8.

Dunsmorel, J. (2019, May 13). James Charles Tati re-upload [Reposted Video]. YouTube. https://www.youtube.com/watch?v=U3Ukl4l_LM8.

Jade, O. (2018, August 6). im sorry [Video]. YouTube. https://www.youtube.com/watch?v=LAJArLC6v70.

Kjellberg, F. [PewDiePie]. (2017, September 12). My response [Video]. YouTube. https://www.youtube.com/watch?v=cLdxuaxaQwc.

Mongeau, T. (2017, February 17). An Apology [Video]. YouTube. https://www.youtube.com/watch?v=Fazh9Lm1kDE.

Paul, J. (2017, June 3). Dear YouTube, I’m sorry…. [Video]. YouTube (min. 10:36-17:43). https://www.youtube.com/watch?v=C45-1rf65PU.

Paul, L. (2018, January 2). So Sorry. [Video]. YouTube. https://www.youtube.com/watch?v=QwZT7T-TXT0.

Star, J. (2017, June 20). RACISM. [Video]. YouTube. https://www.youtube.com/watch?v=Su6FeI7lHVg.

Related Resources

Languaged Life post: Celebrities and Controversies: What Works and What Doesn’t in Apology Videos

Interesting interactive graphic on the history and patterns of apology videos: https://pudding.cool/2020/01/apology/

[/expander_maker]
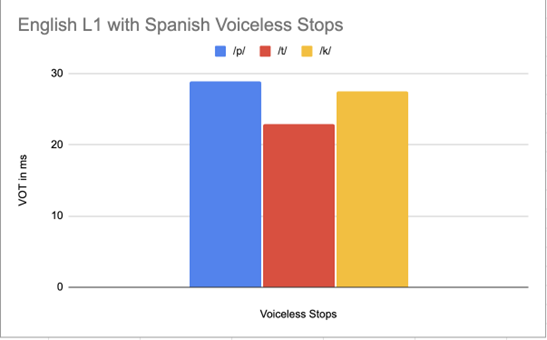
, , ,

Real Talk: Colloquialism in TV Dialogue vs. Natural Conversations

Namrata Deepak, Renee Rubanowitz, Kylie Shults, Alik Shehadeh, George Faville

Iconic TV catchphrases like “Yada-yada-yada,” “D’oh,” That’s what she said,” and “Bazinga!” have been seamlessly integrated into our everyday conversations. Such a phenomenon prompts amusing discussions and questions surrounding the relationship between real-world conversation and on-screen dialogue. While some aspects of on-screen language, like exaggerated accents or absurd dialogue, are accepted as fictional, others are more representative of natural everyday speech. This study delves into the linguistic choices made by sitcom writers to make fictitious situations more comedic and relatable, contrasting our findings with real-world conversations that lack such agendas. In examining the intentional use of linguistic choices by screenwriters to enhance comedic effects in television sitcoms, we hypothesize that scripted language possesses observably fewer contractions, first-person pronouns, second-person pronouns, present tense verbs, more prepositions, and increased word length when compared directly to natural conversation.

Expanding on Biber’s Theory of Multidimensional Analysis (1992) and Quaglio’s analysis of Friends (2009), our research deconstructs and compares the dialogues from The Office (U.S.), Modern Family, and Community with comparable, real-world conversational data obtained from the Santa Barbara Corpus of Spoken American English (Du Bois, 2000-2005). Using Biber’s Factor 1 as a measuring tool that focuses on colloquial language, we selected specific linguistic features to measure their frequency in sitcom clips versus comparable real-life conversations to obtain evidence to explore our hypothesis further.

While our findings generally align with existing evidence for our identified linguistic features, the extent of differences between scripted and natural language could have been more pronounced. Consequently, further research may also be warranted, as our hypothesis was disproved for word length and prepositions, indicating a more remarkable similarity between TV dialogue and natural conversation than expected. Nevertheless, our study contributes to ongoing discourse on the relationship between on- and off-screen language, offering valuable insights into the linguistic choices that shape perceptions of comedic situations and beloved characters.

[expander_maker id=”1″ more=”Read more” less=”Read less”]

Introduction and Background

Situational comedies, or sitcoms, tend to put relatable yet exaggerated characters in outlandish situations to prompt entertainment and humor in audiences (Simply Sitcoms; The situations that precede the comedy). Think about shows like Modern Family, where miscommunications are key to every episode, or The Office (U.S.), where the seemingly ordinary workplace is exaggerated by eccentric characters like Michael Scott. As sitcoms become more intertwined with American popular culture, a fascinating question arises: Do they accurately capture the subtleties of natural conversation?

Further inquiry into scripted banter reveals a core sociolinguistic component – screenwriters make deliberate choices about language that have implications for language learning, language evolution, and more. This study aims to analyze the linguistic differences between dialogue in U.S. sitcoms and natural conversations, focusing on specific linguistic choices that signal colloquialism.

Guided by the question – “To what extent does scripted language represent actual language in depictions of humor?” – our team hypothesizes that the screenwriters for Modern Family, The Office, and Community intentionally use linguistic choices and manipulation to augment comedic effects, resulting in dialogue dissimilar from natural conversation. Specifically, we predict that scripted language has fewer contractions, first-person pronouns, second-person pronouns, more prepositions, and shorter word lengths.

Our target population consists of the participants in the selected conversations: the characters in Modern Family, The Office, and Community, as well as the actual family members, coworkers, and friends in the recordings we used. Together, these participants form a sample of sitcom characters and a sample of the general American population, which we will contrast to test our hypothesis.

To further analyze and gather more resources to support our investigation, we turned to previous case studies exploring scripted language’s limitations compared to organic speech, including a study on the sitcom Friends (Quaglio, 2009). Additionally, we referenced Bednarek’s study on Gilmore Girls (2011), which analyzes how a show’s dialogue contributes to creating a specific kind of dialogue unique to itself and defining the genre it is a part of. Though we are expanding on past theories, we acknowledge the need for extended research on more contemporary and diverse sitcoms for the most comprehensive overview of these rich hypotheses.

Methods

Our research question led to three critical questions when designing our study: what data are we using, what linguistic features are we focusing on, and how will we collect data?

What data are we using?

For data, we chose to look at situational comedies since they tend to mirror (and potentially exaggerate) everyday situations. We transcribed 2-3 minute conversations from the first and last seasons of Modern Family, The Office, and Community, constituting our scripted dialogue corpus. We then found contextually similar real-life conversations to each show (between family members, coworkers, and friends, respectively) from the Santa Barbara Corpus of Spoken American English and chose three 2-minute segments from each one to transcribe.

Figure 1. Descriptions of the data samples used.

What linguistic features are we focusing on?

When selecting our linguistic features, we used Factor 1 of Biber’s Multidimensional Analysis as a starting point since it was theorized to show the most significant difference between humor and natural conversation (Eberhardt, 1988). We believe a crucial reason for this difference is because of colloquialism, which is what Factor 1 measures – in real life, we are likely to be more colloquial and use less intentional language, unlike TV, where dialogue is meant to produce entertainment. We focused on contractions, first-person pronouns, second-person pronouns, present tense verbs, prepositions, and word length.

How did we collect the data?

For contractions, first-person pronouns, second-person pronouns, and prepositions, we used a software called AntConc to measure the frequency of each variable within each conversation (see the figure below for the specific terms we used). We counted present tense verbs manually. For word length, we took the total number of characters within the dialogue and divided it by the number of words to produce an average character length for each word.

Figure 2. Search entries used in AntConc.

Results and Analysis

After we collected our data, we mapped it visually, with “Words Per Minute” as the y-axis and “Linguistic Features Analyzed” as the x-axis, including columns for each scenario. When analyzing and interpreting the data, we focused on the most significant disparities between linguistic features in the sitcoms and the in-person interactions. We also calculated the average number of differences across all linguistic features compared to natural conversations.

Modern Family

Below are excerpts and transcripts from a Modern Family (Levitan, et. al, 2009-2020) episode and the “Appease the Monster” family conversation from the Santa Barbara Corpus of Spoken American English (Du Bois, 2000-2005). The most apparent difference between the two sources is the degree of interruption – the natural conversation shows much more overlap. At the same time, the sitcom mostly has one line occurring at a time. This variation can mainly be attributed to the practical demands of filming a TV show, so we focused on more specific word choices to see if the actual language (rather than its delivery) also differs.

We assessed 1:45-2:30 of the Modern Family clip below:

Figure 3. Transcript of Modern Family ”Coal-Digger” conversation.

We assessed 0:00-1:00 of the “Appease the Monster” conversation here: Audio Recording of the “Appease the Monster” Conversation (0:00-1:00)

Figure 4. Transcript of the “Appease the Monster” conversation.
Figure 5. Linguistic comparison of Modern Family clip vs. “Appease the Monster” conversation.

After measuring our selected linguistic features within the Modern Family and “Appease the Monster” conversations, we can see in Figure 5, illustrating linguistic features on the x-axis and frequency on the y-axis, that natural conversations have more first-person pronouns, second-person pronouns, and contractions – all supporting our hypothesis. However, the remaining categories – present tense verbs, average word length, and prepositions – all display a relationship that is inverse to the predictions of our hypothesis.

The Office

Figure 6. Linguistic comparison of The Office vs. “Bank Products” conversation.

As we hypothesized, The Office comparison chart above shows that natural conversations use more first-person pronouns, second-person pronouns, and contractions. However, the data in Figure 6 does not substantiate predictions that natural conversations would use more present tense verbs, shorter word lengths, and fewer prepositions.

Community

Figure 7. Linguistic comparison of Community vs. “Lambada” and “Wonderful Abstract Notions” conversations.

We can see in the Community comparison chart above that while natural conversations have more second-person pronouns and contractions, the rest of the linguistic categories display an inverse relationship to what was predicted, subsequently disproving our hypothesis. 

Synthesis

Figure 8. Average number of each linguistic feature in TV dialogues vs. in natural conversations.

Thus, Figure 8, which illustrates the average difference between all of our observed television programs and real-life conversations, demonstrates that sitcoms followed our hypothesized patterns for first-person pronouns, second-person pronouns, contractions, and present-tense verbs. However, when looking at average word length and preposition frequency, the sitcoms showed results that were opposite to what was expected, with shorter words and fewer prepositions. An important note is that, except for contractions, the differences seen are very slight.

Figure 9. Average difference in number of each linguistic feature between each show and the corresponding natural conversation(s).

To zoom in a little further, Figure 9 complicates our results as we look at the specifics of each show. Modern Family is the only show that demonstrated fewer first-person pronouns than the corresponding natural conversation. Community is the only show with fewer present tense verbs than its corresponding natural conversation, per our hypothesis. The Office appears the most natural, disobeying our hypothesis for the linguistic features of word length and prepositions. As mentioned, all three shows did not follow our hypothesized difference in average word length or prepositions, suggesting that our sitcom data is considerably closer to natural conversation than expected.

Discussion and Conclusion

From the data analysis we conducted, we concluded that while there is a slight difference between TV and natural conversations (especially for first-person pronouns, second-person pronouns, contractions, and present tense verbs), the differences are insignificant and do not indicate much deviation. Additionally, the data disproved our hypotheses around word length and prepositions; regarding these features, sitcoms were more “natural” than actual natural conversations. However, we acknowledge the fact that our investigation had limitations. Due to the narrow timeline of our project this quarter, we did not collect and analyze as much data as we would have hoped in order to find more substantial differences between scripted and non-scripted language.

Revisiting our initial research question: To what extent does scripted language represent actual language in depictions of humor?

Initially, our data may seem surprising since we found fewer differences than expected, but there might be a reason why these sitcoms tend to lean more toward natural-sounding conversations. The craft of screenwriting tiptoes on a delicate balance between accurately portraying real-life scenarios and creating humorous and engaging dialogues meant to captivate audiences. Our three Emmy Award-winning shows have achieved widespread acclaim and popularity, and part of this success can be attributed to linguistics, as their language choices play a crucial role in effectively resonating across various audiences and demographics.

TV dialogue has far-reaching linguistic influence, especially in the language learning classroom, where teachers often encourage students to use sitcoms (and other scripted content) to practice English and attain competency. The nuances of our data suggest that while the language English learners are studying has a certain degree of difference from conversational English, it still shares similarities to natural language and, thus, may serve as a helpful tool. Taking our research in conjunction with Quaglio’s study on Friends (which did find a significant difference) suggests that more research is needed to see how this could affect the language learning process and whether sitcoms are practical language learning tools (Quaglio, 2009).

Additionally, Quaglio’s findings suggest that TV dialogue is its own register of English, different from the spontaneous and natural conversation it hopes to (and is assumed to) emulate. Our data complicates this theory, indicating that this register is becoming closer and closer to standard/conversational English with our three sitcoms or that more research is needed to ferment a pattern. To read more about the role of TV in social development and cultural unity, read this blog post: “Role of Television in Sociocultural Development of a Society.” To see more concrete examples of the linguistic reach of TV, read this article about words and practices that natural conversation has borrowed from TV dialogue: 10 Ways Television Has Changed the Way We Talk.

To expand on this topic further, it would be important to attain cross-linguistic data. How do these patterns of difference occur in other languages? Due to the importance of media to culture, this would help clarify whether TV dialogue is simply a register of English or a cross-cultural phenomenon.


References

Biber, D. (1992). On the complexity of discourse complexity: A multidimensional analysis. Discourse Processes, 15(2), 133–163. https://doi.org/10.1080/01638539209544806.

Bunniefuu. (2013, May 17). 09X24/25 – finale. The Office Transcripts. https://transcripts.foreverdreaming.org/viewtopic.php?t=25498#google_vignette.  

Du Bois, J. W, et. al (2000-2005). Santa Barbara Corpus of Spoken American English | Department of Linguistics – UC Santa Barbara. UCSB Linguists. Retrieved May 20, 2024, from https://www.linguistics.ucsb.edu/research/santa-barbara-corpus.

Eberhardt, S. (1988). Identifying_Multidimensional_Patterns_across_Register_Variation. Retrieved May 6, 2024, from https://www.unibamberg.de/fileadmin/engling/fs/Chapter_21/Index.html?23DimensionsofEnglish.html.

Gervais, Merchant, et. al (Executive Producers). (2005-2013). The Office [TV Series]. Deedle-Dee Productions; 3 Arts Entertainment; Shine America; Universal Television.

Hoey, E. (2018). Conversation analysis. https://pure.mpg.de/rest/items/item_2328034_3/component/file_2328033/content.

Levitan, Lloyd, et. al (Executive Producers). (2009-2020). Modern Family [TV Series]. Steven Levitan Productions; Picador Productions; 20th Century Fox Television.

Nini, A. (2019). The Multi-Dimensional Analysis Tagger. In Berber Sardinha, T. & Veirano Pinto M. (eds), Multi-Dimensional Analysis: Research Methods and Current Issues, 67-94, London; New York: Bloomsbury Academic.

Quaglio, P. (2009). Television Dialogue and Natural Conversation: Linguistic Similarities and Functional Differences. Corpora and Discourse, 189-210. https://aogaku-daku.org/wp-content/uploads/2018/04/Television-dialog-corpora-and-discourse.pdf.

Russo, Russo, Harmon, et. al (Executive Producers). (2009-2015). Community [TV Series]. Krasnoff/Foster Entertainment; Russo Brothers Films; Harmonious Claptrap; Universal Televsion; Sony Pictures Television; Yahoo! Studios.

The Office (USA) – season 1 episode 1: “pilot. Genius. (2005). https://genius.com/The-office-usa-season-1-episode-1-pilot-annotated.  

Zago, R. (2017). English in the Traditional Media: The Case of Colloquialisation Between Original Films and Remakes. Transnational Subjects Linguistic Encounters: Selected papers from XXVII AIA Conference, 2, 91-104. https://unora.unior.it/bitstream/11574/176955/1/Atti%20AIA%20curatela.pdf#page=119.

[/expander_maker]
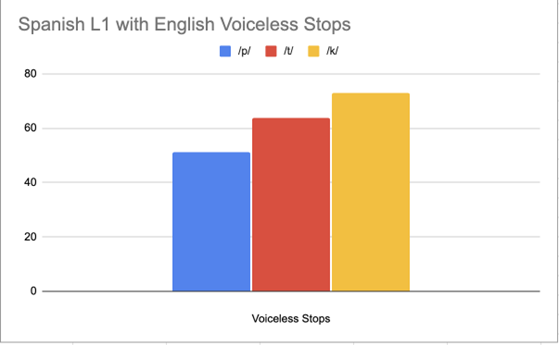
, , ,
Scroll to Top