identity

All Jokes Aside – Indexing Gender and Race in Stand-Up Comedy

Ammi Lane-Volz, Cate Dark, Ava Kaiser, Grace Shoemaker, Alex Farfan

As playful and harmless as something titled “comedy” can seem, the political and cultural implications of what is deemed funny are not insignificant. From stand-up performance to jokes around the water cooler, comedy is used as a tool to socially bond, establish hierarchy, critique global affairs, and index identity. Our project set out to explore how stand-up comedians index their identities through mimicry, contrast, and slurs, specifically focusing on how they index themselves as part of versus separate from gendered and racial groups. We studied the specials of ten stand-up comedians from the Netflix series The Standups to see if they more often tended to align their identities through references to their own demographics (in-group indexing) or through references to outside groups (out-group indexing). We found several patterns that emerged, including higher instances of non-white comedians mentioning their race (three times more often), 60% of which consisted of in-group indexing. We also found the opposite to be true for gender, with men referencing gender almost twice as often as the female comedians, 55% of which consisted of out-group indexing. These patterns invite several follow-up questions on the different tactics comedians use when writing their sets and how their choices might be influenced by their place in society and membership of different social majority or minority groups.

[expander_maker id=”1″ more=”Read more” less=”Read less”]

Introduction and Background

Comedy holds significant cultural influence, serving both as a mirror reflecting societal norms and as a tool for challenging them. We identified a notable gap in research relating to how stand-up comedians utilize their demographic backgrounds. A study done on representations of race and gender within Comedy Central programming found that although the channel has made an effort to expand its brand by employing more female and racially diverse comedians, the type of jokes found within these skits reinforce power dynamics and white heteronormative masculinity (Marx 2016). Another study on stand-up comedy and cultural spread argued that stand-up comedians are able to reinforce and/or challenge existing cultural stereotypes through their sets, both within the comedic monologues themselves and in the audience’s minds (Yus 2002). Based on this research, it is evident that a comedian’s own demographic information, specifically gender and race, can play a role in the creation or reinforcement of stereotypes in comedy. Yet none of these studies discuss the ways in which comedians index their own demographics. To fill this gap, we wanted to answer the question of how comedians navigate indexing their identities by looking at the frequency of in-group versus out-group demographic references and how these references connect to broader social contexts.

Methods

For our analysis, we chose to look at ten thirty-minute stand-up specials from seasons two and three of the Netflix series The Standups. Each episode of this show focuses on a different stand-up comedian. Comedians from this show are of moderate acclaim, meaning their sets are polished (i.e. representative of a “standard” professional stand-up comedian) but the researchers and the general public may not know the comedians by name. Choosing specials from this show allowed for some standardization of the audience and venue, and provided us with a broader view of multiple professional stand-up comedians than just analyzing one or two longer specials.

Each researcher looked at two randomly chosen specials and noted each time that a comedian mentioned their own identity demographic (race, gender, sexuality, political affiliation, class, and age) and each time they made a comparison to another demographic. These comparisons included strategies like direct comparison or mimicry of another demographic’s accent or physical mannerisms. We also noted each time a comedian said a slur related to their own identity demographic and each time they said a slur related to a different demographic. Based on our preliminary data, we decided to whittle down our focus from the six demographic categories mentioned above to just race and gender. Within these categories, we split them into white vs. marginalized racial identity and men vs. women, respectively. It is also important to note that our sample was evenly split in terms of gender (five men, five women) and race (five white comedians, five comedians of color).

Data and Analysis

Using the data we collected for each comedian, we generated the following figures that summarize our findings:
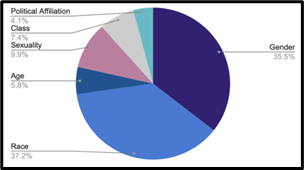
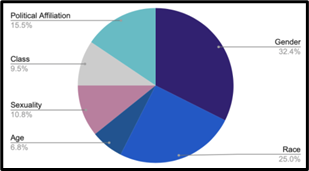
Figure 1: Total Number of References Made by Each Comedian to Their Own Demographics
Figure 2: Total Number of Comparisons Made by Each Comedian to Another Demographic

As seen in Figure 1 and Figure 2, comedians tend to reference and compare their gender and race significantly more than age, class, sexuality, or political affiliation. Using this information, we were able to narrow our analysis to focus on this key demographic data.
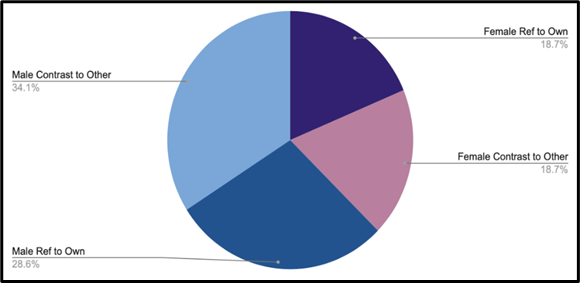
Figure 3: Total Number of Male Vs. Females References to Gender

Figure 3 demonstrates that male comedians were much more likely to reference gender to index their identities, with comparison to another gender being the most common reference type.
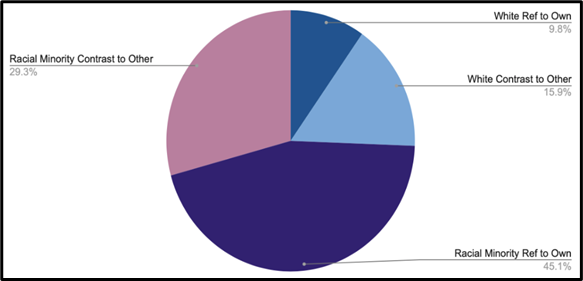
Figure 4: Total Number of White Vs. Racial Minority References to Race

Figure 4 indicates that racial minority comedians referenced race about three times more than white comedians, with references to their own race being the most common reference type. 
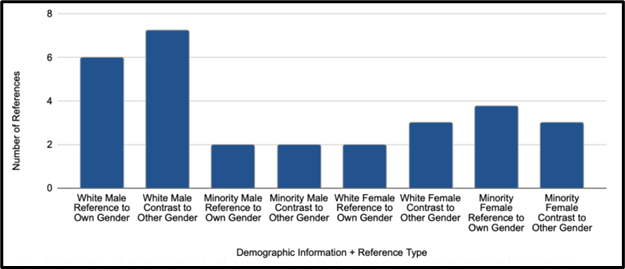
Figure 5: Average Intersectional (Race and Gender) References to Gender

Figure 5 indicates that white men were about two times more likely to reference gender than any other demographic combination.
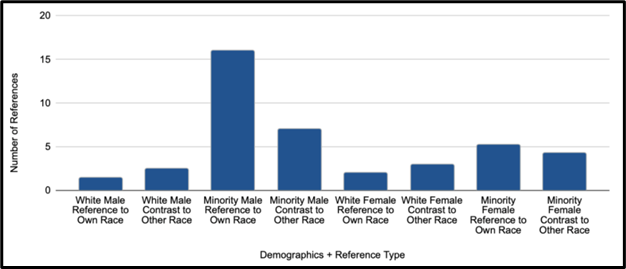
Figure 6: Average Intersectional (Race and Gender) References to Race

Figure 6 shows that minority men were three times more likely to reference their own race than any other combination of race and gender.
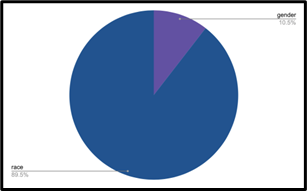
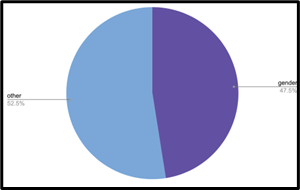
Figure 7: Total Number of Slurs Related to Comedian’s Own Demographic
Figure 8: Total Number of Slurs Unrelated to Comedian’s Own Demographics

Figure 7 shows the large majority of self-referential demographic slurs were race-related, as Black comedians tended to use the n-word multiple times in their sets. Figure 8 shows that out-group related demographic slurs were slurs related to gender and other demographics; none were race-related.

Raw Data

anthroling comedy data

Discussion

Based on our data and outside research, the frequency with which comedians index their race and gender within their sets may be linked to a few different social phenomena.

The finding that white men are more likely to index their gender identity in their comedic routines may suggest that male comedians feel compelled to incorporate their gender identity into their comedy routines, or that they find this to be more socially acceptable than women. This could reflect broader gender expectations where men are often encouraged to assert their masculinity or draw attention to their gender in public spaces (McVittie et al., 2017). Racial minority comedians’ tendency to reference their minority status could indicate a desire to confront stereotypes, draw attention to racial issues, or establish a unique comedic identity. This could stem from personal experiences of marginalization or a sense of responsibility to address racial dynamics in their performances (Sullivan et al., 2021). Additionally, the observation that power dominant demographics (white, men) more commonly used comparison than their marginalized counterparts could imply that those in positions of power feel more comfortable using comparison as a comedic tool. This could be because they have greater societal latitude to freely express themselves without fear of repercussions (Tobore, 2023). By using comparison, minority comedians risk reinforcing existing power dynamics and societal hierarchies where masculinity and whiteness are considered the norm. For a minority comedian, refraining from such comparisons can be a way to affirm their own racial or cultural identity without centering whiteness as a point of reference. Finally, the fact that gendered slurs were employed by out-group comedians, while race based slurs were only used by in-group racial minority comedians suggests a greater societal awareness or sensitivity towards racial issues than gender issues. This may stem from a recognition of the historical and ongoing harm caused by racial slurs (Wilson, 2020). Overall, our findings underscore how the comedy stage becomes a microcosm for broader societal interactions and power relations. The act of indexing one’s identity in comedy can serve as a means of negotiating power, identity, and belonging within a societal context that is stratified along lines of race, gender, and sexuality.

In general, comedy does not merely reflect the social order but actively participates in its construction and perpetuation. The comedian’s role in creating a “social contract” with the audience, wherein their narratives and identities are validated, highlights the performative aspect of social identity and the power of narrative in shaping reality. The audience is also not merely a passive receiver of comedy; they have agency in choosing where to laugh and where not to laugh. They are then an active participant in the co-creation of the comedic experience and, by extension, the social norms and power dynamics it reinforces or challenges.

Conclusion

This research underscores the potential of comedy as a site of social commentary and critique. While comedy can perpetuate stereotypes and power imbalances, it also holds the potential for subversion. Comedians who are aware of the power dynamics at play in their performances can use humor to challenge societal norms, question stereotypes, and imagine new ways of being.

In framing our findings within the broader context of power relations, language, and agency, we contribute to a deeper understanding of the role of comedy in society. This opens up important discussions about the responsibilities of comedians and audiences alike in shaping the social discourse through humor. It also suggests avenues for further research into how comedy can be used as a tool for social change, by both reinforcing and challenging the status quo.

References

Marx, N. (2016). Expanding the brand: Race, gender, and the post-politics of representation on Comedy Central. Television & New Media, 17(3), 272–287. https://doi.org/10.1177/1527476415577212

Miller, T. (Producer). (2017-2021). The Standups [TV Series]. Netflix. https://www.netflix.com/browse?jbv=80175685

McVittie, C., Hepworth, J., & Goodall, K. (2017). Masculinities and health. The Psychology of Gender and Health, 119–141. https://doi.org/10.1016/b978-0-12-803864-2.00004-3

Sullivan, J. N., Eberhardt, J. L., & Roberts, S. O. (2021). Conversations about race in black and white US families: Before and after George Floyd’s death. Proceedings of the National Academy of Sciences, 118(38). https://doi.org/10.1073/pnas.2106366118

Tobore, T. O. (2023). On power and its corrupting effects: The effects of power on human behavior and the limits of Accountability Systems. Communicative & Integrative Biology, 16(1). https://doi.org/10.1080/19420889.2023.2246793

Wilson, C. (2020, October 4). N-word: The troubled history of the racial slur. BBC News. https://www.bbc.com/news/stories-53749800

Yus, Francisco. (2002). Stand-up comedy and cultural spread: The case of sex roles. Babel A.F.I.A.L.. special issue on humour studies. 245-294. https://personal.ua.es/francisco.yus/site/Afial.pdf

[/expander_maker]

, , , , , ,

Bilingual Investigation

Hana Almony, Lauren Campsey, Hannah Her, Ariana Cheng, Madeline Flood

In everyday discourse, language is influential in how we speak and engage with others. Specifically, looking at bilingual native Spanish, second language English speakers was explored in this study because the question we sought to answer was does an individual’s native language have an influence on a second language? To investigate this question, we hypothesized that it indeed does, and the language that one speaks will impact responses to the same interview questions in both Spanish and English. In conducting this research, agents of socialization were considered because the participants were native Spanish speakers with English as a second language so interview questions were geared towards the significance of language in relation to identity and self-expression. Moreover, this relates to the idea of linguistic relativity as this shows that one’s particular language use is correlated with one’s perception and idea of reality. In this study, linguistic relativity was evident when analyzing bilingual female individual participants in which we found similarities and differences in responses of each respective language. The goal of this study is to inform about the effects of language use through the modality of bilingual speakers and how language choice through one’s thinking may connect to specific conversations and everyday discourse.

[expander_maker id=”1″ more=”Read more” less=”Read less”]

Introduction and Background

Have you ever thought about how the language you speak affects the way you view the world around you? By understanding how language functions within society we can have a greater understanding of how impactful linguistic practices can be. For our project we chose to view bilingualism and how modality can affect perception. More specifically, in the context of native Spanish speakers with English as their second language. To investigate this hypothesis we used points of reference from Claire Kramsch’s Language and Culture and Nick Riemer’s book called Routledge Handbook of Semantics. Riemer’s book is a collection of the works of many leading scholars and academics from around the world. Both Kramsch and Reimer provide an overview of entire linguistic subjects and sub-disciplines. We focused on chapters such as modality, participant roles, and linguistic relativity in order to gain meaning and conceptualization. We also read articles from the Linguistic Society of America such as “Language and Thought” and “Linguistics in Everyday Life” to gain a greater understanding of linguistic theories in order to apply them to our research. We looked specifically at linguistic relativity to answer our question on how language can influence perception and the way we think paired with bilingual studies to help analyze differences within Spanish-English speakers.

Methods

To gather our data, we were able to interview five female individuals in the UCLA community who are native speakers of Spanish and also learned English as a second language. The setup of the interview was semi-structured and in-person with audio-recording for each participant. Two separate interviews were conducted by a bilingual group member, consisting of the same set of 10 questions in English and Spanish. Questions varied from how being bilingual affects communication and expression and how they use it in their daily lives. We also had controls in our study to limit variability throughout the interviews. The controls are the same set of interview questions in both English and Spanish, one interviewer to maintain the same personality and comfortability throughout the interviews, the same gender combination of a female interviewer and female participant for similar interaction types, having the participants bilingual in those two languages only, and maintaining similar environment conditions (time of day, public, and approximate number of people around). After the audio files finished processing, each version was manually transcribed by each group member and compared to see any similarities or differences in results. We looked into various aspects of modality in bilingualism and how it affects conversations and word choice. In relation to our hypothesis, the comparison between each interview was very surprising.

Results and Analysis

Throughout our interviews, we found that there were many similarities and differences in the participants’ responses. Though we were expecting differences specifically between each participant’s English and Spanish answers, we learned that the language didn’t completely dictate how the participants expressed themselves. The responses in general in both Spanish and English were very similar, if not the same, in both languages. The participants also all agreed that they spoke with an accent in English and Spanish, reflecting the influence on each language. The participants’ linguistic identities have pieces of English and Spanish – they are aware of their link to each of these languages and cultures, creating a consciousness in their pronunciations. We also noticed that when answering questions in Spanish, there were more pauses – these pauses did not have a specific pattern and differed between the participants, indicating that this has to do with their thought process in word choice. The participants shared that they mainly spoke Spanish with their family members and occasionally with friends depending on the environment. This language-specific context shows that they associate their linguistic identity with English for most of their communication, hence the pausing had more to do with comfortability with the language than for cultural reasons. Another way the interviews differed was the length and detail within answers in Spanish compared to English. According to Reimer (2016), a language can influence what or how much information is shared by the speaker. This was apparent when analyzing the different answers for each language. The English responses were more engaging and personal compared to in Spanish, signifying a linguistic influence over word choice and sentence length.

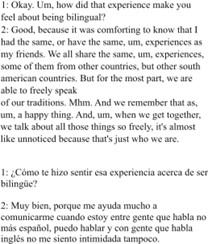
Figure 1: Sample responses in English and Spanish for the interview question “Happiness to me is …”
Figure 2: Sample responses in English and Spanish for the interview question “When did you start speaking Spanish and when did you start learning English?”

The examples above show the main findings of our study. Figure 1 highlights our last interview question, “Happiness to me is …” All of the participants’ answers had to do with love for someone – in this example, family. This depicts how the answer to this particular question was the same in both languages, reflecting that the individual shares the same values and thoughts in both languages. The lack of detail was prominent in many other questions as seen in Figure 2, asking the question, “When did you start speaking Spanish and when did you start learning English?” Though the general answer was similar, the participant went into more detail about their childhood when answering in English. The concept of linguistic relativity, though not in the traditional sense, was prominent in our study – the participants were all L2-English Native Spanish speakers and through their answers, we can see how, outside of family, English is the more spoken language, creating a sense of normalcy and identity within the English language.

Discussion and Conclusions

Within a conversation, the particular language an individual is speaking in can influence how they express themselves and this can largely be attributed to how culture and language are so intertwined (Kramsch, 2014). With this connection in mind, we hypothesized that L2-English Native Spanish speakers will have different responses to the same questions depending on the language that they are speaking in. Though our assumption was that there would be vastly different responses, in reality, the degree of the linguistic relativity of the responses was not as high as anticipated. The data revealed that participants had very similar responses in both languages, but the Spanish responses were shorter and less detailed than the English responses. We observed agents of socialization when analyzing our interviews as L2-English Native Spanish speakers had a deeper connection to their family structure. We learned that these specific participants have mainly tied Spanish to family members and situations. The connection between language and their background creates strong cultural bonds within the community. There were limitations in our study that may have contributed to our results. There were a total of five participants. This is a relatively small sample size. If a similar experiment were to be done in the future, the results would be more accurate with a larger sample size for a greater range in human variability to produce a more precise conclusion. These participants, though native Spanish speakers, have grown up and lived in the United States for a majority of their lives – we did not take into consideration the role of cultural assimilation, reflecting the likelihood that their answers in both languages would be very similar. This raises the question of how the participants relate to Spanish. The results of our study have taught us the role of language in our thought process and communication and the importance of being more aware and mindful in our everyday interactions as our language choice can contribute to how others feel in the conversation.

References

Aneta Pavlenko, Blackledge, A., Piller, I., & Teutsch-Dwyer, M. (2001). Multilingualism, Second Language Learning, and Gender. Berlin, New York De Gruyter Mouton.

Becker, K. R. (1997). Spanish/English Bilingual Codeswitching: A Syncretic Model. Bilingual Review / La Revista Bilingüe, 22(1), 3–30. http://www.jstor.org/stable/25745367

Bohman, T. M., Bedore, L. M., Peña, E. D., Mendez-Perez, A., & Gillam, R. B. (2010). What you hear and what you say: language performance in Spanish–English bilinguals.

International Journal of Bilingual Education and Bilingualism, 13(3), 325–344. https://doi.org/10.1080/13670050903342019

Comrie, B. (2012). Language and Thought | Linguistic Society of America. Linguisticsociety.org. https://www.linguisticsociety.org/resource/language-and-thought

Jacqueline Toribio, Almeida. “Code‐Switching among us latinos.” The Handbook of Hispanic Sociolinguistics, 4 Feb. 2011, pp. 530–552, https://doi.org/10.1002/9781444393446.ch25.

Jesús-Ortiz, E., & Calvo-Ferrer, J. R. (2023, November 25). His or Her? Errors in Possessive Determiners Made by L2-English Native Spanish Speakers. Languages, 8(4), 1-16. https://doi.org/10.3390/languages8040278

Kanno, Y. (2003). Negotiating bilingual and bicultural identities: Japanese returnees betwixt two worlds. L. Erlbaum.

Kramsch, C. (2014). Language and Culture. AILA Review, 27(1), 30–55. https://doi.org/10.1075/aila.27.02kra

Linguistics in Everyday Life | Linguistic Society of America. (n.d.). Www.linguisticsociety.org. Retrieved March 16, 2024, from https://www.linguisticsociety.org/content/linguistics-everyday-life#Domain

Niño-MurciaM. (2009). Bilingualism and identity: Spanish at the crossroads with other languages. Benjamins.

Ramírez, D. (2003). L1 regression in Spanish-English bilinguals. In Selected proceedings of the first workshop on Spanish sociolinguistics (pp. 89-95). Somerville: Cascadilla Proceedings Project.

Riemer, N. (2019). The Routledge handbook of semantics. Milton Park, Abingdon New York, Ny Routledge.

Slobin, D. (1996). Social interaction, Social Context, and Language. Psychology Press.

 [/expander_maker]
, , , ,

Fluency Ideologies Amongst Undergraduate Bi- and Multilinguals

Kendall Vanderwouw, Rachel Liu, Julia Tran, Nessa Laxamana, Thalia Rothman

UCLA is an incredibly diverse institution, with over 5,000 international students and 100 nations being represented. It is no surprise, then, that they boast a variety of cultural and linguistic backgrounds. From this wealth of information, we sought to explore fluency ideologies amongst bi- and multilingual undergraduates, aged 18 to 22. Through this course and personal experiences, it’s become evident that the definition of fluency is in constant flux. A largely self-defined term, fluency could encompass everything from native-level repertoire to conversational proficiency. Thus, we aimed to investigate whether linguistic background impacted self-perception of fluency.

We engaged in semi-structured interviews with 30 undergraduates to explore this phenomenon and its implications amongst different languages. As we dove deeper, however, we observed little variation in how different languages defined fluency. Rather, most participants revealed similar definitions, centering around, “the ability to express feelings and complex ideas.” Instead, participants expressed a positive relationship between self-perceived fluency and a sense of familial or cultural connection. This finding and others ultimately led us to a new research question that targeted whether an individual’s fluency in a language, upbringing, environment, and cultural background can influence linguistic identity.

[expander_maker id=”1″ more=”Read more” less=”Read less”]

Introduction and Background

Our research began with questions regarding linguistic identity and fluency. Why do definitions of fluency fluctuate? Are definitions of fluency influenced by our linguistic backgrounds? What is the role of fluency in our cultural lives? Our participant pool represented a variety of cultural and linguistic backgrounds with which to answer these questions. This unique context provided a near-direct perspective into the context of language acquisition since many students had recently left backgrounds of language learning or were still in proximity to them, such as high school and familial environments.

We examined these curiosities through a series of interviews, taking an ethnographic approach to gain a more holistic understanding of the perspectives of our participants. After consolidating interview data, our research focus pivoted in a slightly different direction, one that looked at how a variety of factors—including fluency—can influence one’s linguistic identity. Our central research question was finalized as such:

Does an individual’s fluency in a language, upbringing, environment, and cultural background influence their linguistic identity?

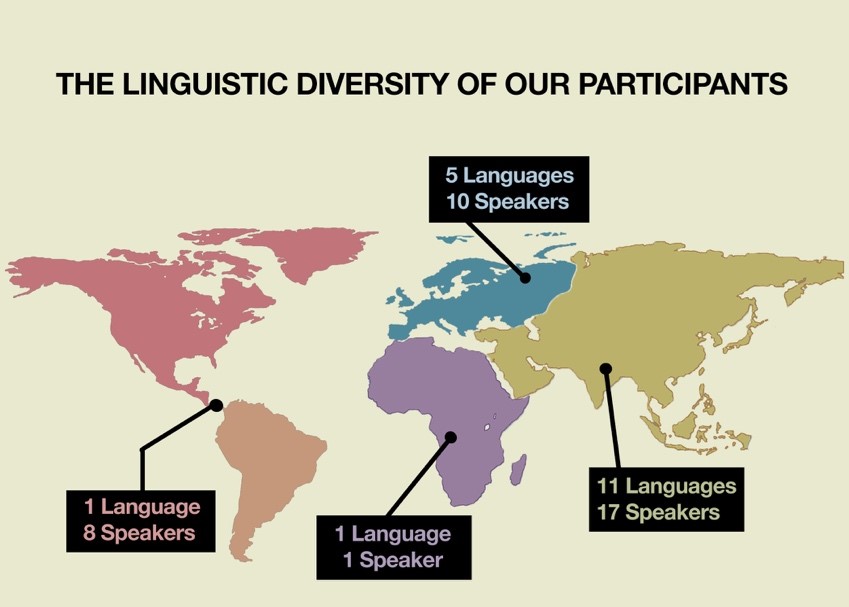
Overall, our project ultimately represented a variety of linguistic backgrounds and cultural identities, with 18 languages spoken by 30 different speakers. This is visually represented in Figure 1, created by one of our group members to illustrate the linguistic diversity of our participants.

Figure 1: Tran, J. (2024). A map illustrating the linguistic and cultural spread of our participants

 To garner a more in-depth understanding of our topic and to examine the current state of research, we engaged with readings regarding fluency ideologies as well as bi- and multi-lingual experiences. Such research provided context that informed our later analyses and conclusions.

For example, we found in several articles (Zubrzycki 2019; King 2013) that self-perceived fluency had the potential to give rise to shame or embarrassment in being unable to match the proficiency of others who may be exhibiting native-level fluency. Such ideologies create the daunting expectation that fluency necessitates a native-level mastery of a language. In addition to these academic sources, we found similar ideologies being proliferated through less formal means, such as YouTube videos. One video from Ted-Ed discussed the benefits of bilingualism to our brains, and in doing so put forth the concept of a “balanced bilingual,” which they describe as an individual who has equal proficiency in their languages. The video puts this idea forth, however, in order to make the point that the majority of bi- and multi-lingual speakers use their languages in different proportions and in varying scenarios. We found that videos such as this help to contribute towards a less stringent narrative of fluency that could lessen the shame caused by self-comparison to native speakers. 

Figure 2; Ted-Ed. (2015). A screenshot from the Ted-Ed video discussing bilingualism and how it may affect an individual’s brain.

This left our group wondering whether such ideologies would be found amongst our participants, and what factors would lead to the formation of the expectation to be natively fluent. Overall, these initial investigations revealed to us that there are certainly links between linguistic identity and fluency self-perception. Our goal through this project was to contribute to this existing pool of knowledge and to provide a voice for our participants to express their unique ideologies.

Methods

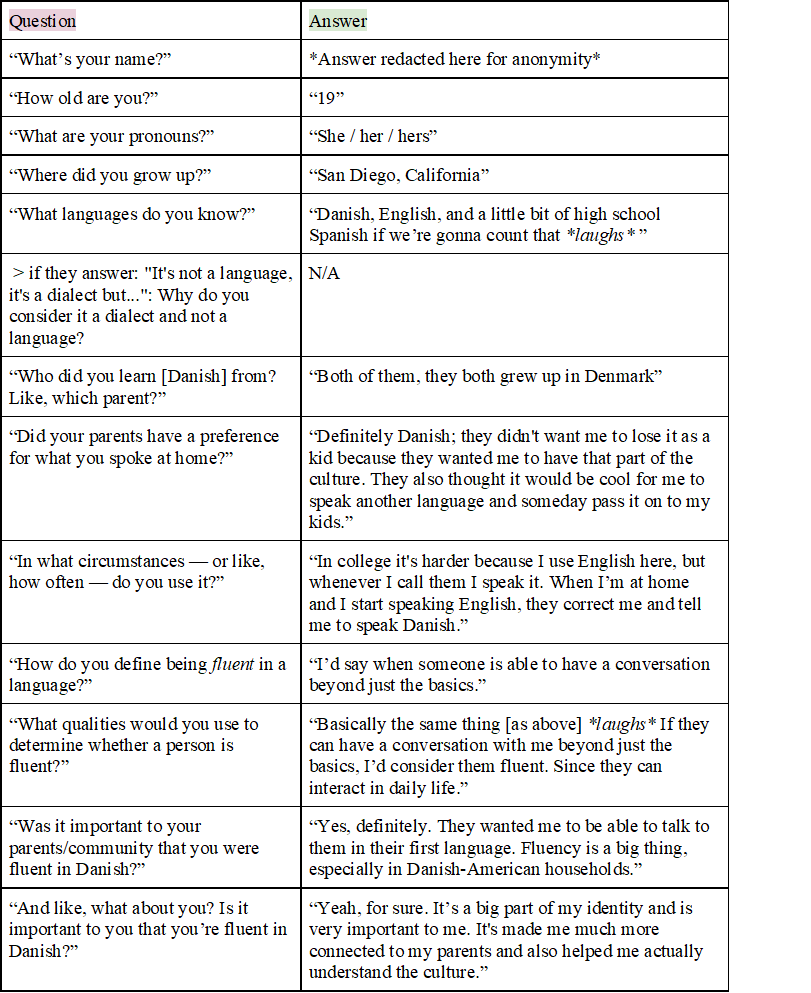
Using semi-structured interviews, comprising of 12 standardized questions, we decided to take an ethnographic approach to our data collection. Through this process, we searched for self-perceptions of fluency, past language acquisition environments, as well as any current language ideologies regarding themselves. This methodology was deliberately chosen in order to produce consistent, qualitative data while also providing room for our participants to elaborate upon concepts and topics of their choosing. When permission was granted, we recorded the interviews for the purpose of deeper analysis as well as direct quoting in our project. Our participant pool were undergraduate college students, aged 18 to 22 years old.

Some of the questions that we asked were as follows: “In what circumstances / how often do you use this (these) language(s)?”, “How do you define being “fluent” in a language?”, and “Was it important to your parents/community that you were fluent in this language? What about you?”

Results and Analysis

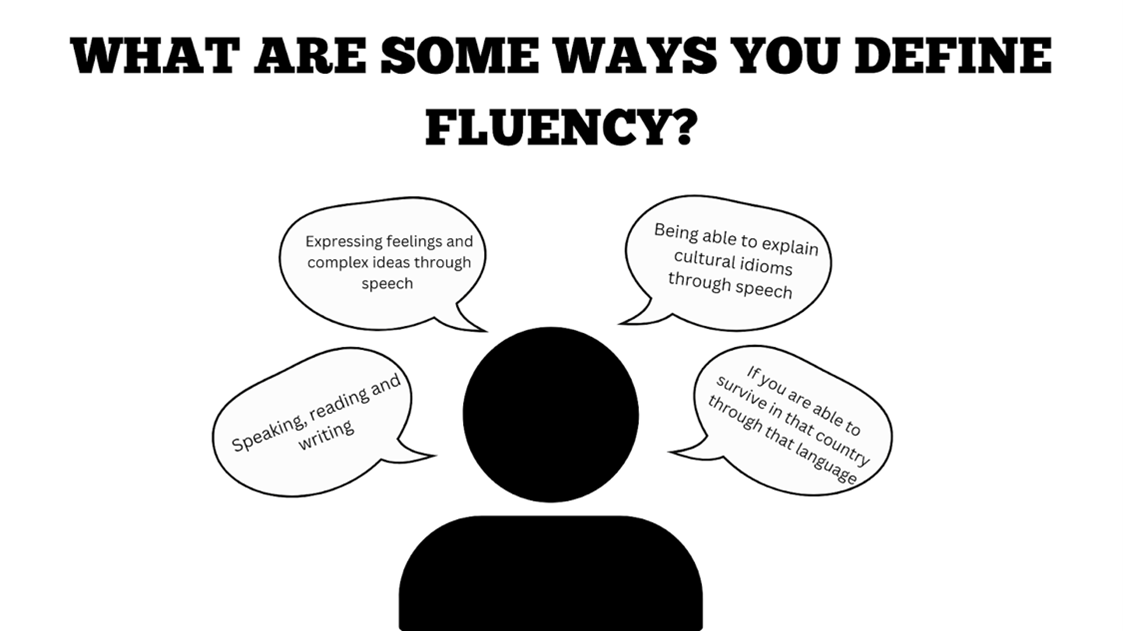
Our data provided us with different viewpoints and ideologies regarding bilingualism and multilingualism. However, 60% of our participants defined fluency as the ability to express feelings and complex ideas, beyond the introductory phase in the language they speak. Some participants were more descriptive, stating that the ability to speak about specific things, such as the country’s government system, or even cultural idioms or slang. Some were less specific, stating that if you can get by in daily scenarios, you are fluent. 

Figure 3; Laxamana, Nessa. (2024). A graphic showcasing how our participants defined fluency.

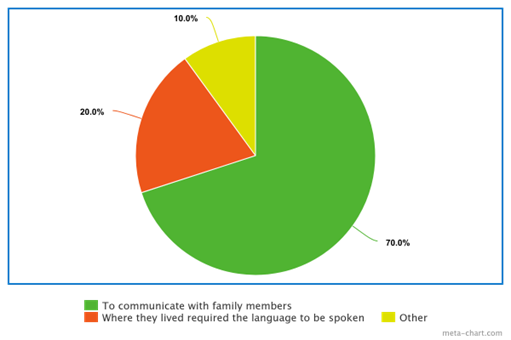
We also were able to discover different values that our participants held knowing their other language(s). 77% of our participants stated that they used their language to communicate with their family members, which is why they were able to become fluent in their language. This shows that language serves as a communication between different generations of people, for example between grandkids and grandparents.

Figure 4; Laxamana, Nessa. (2024). A pie chart illustrating when and where our participants use their non-dominant languages.

We interviewed those born in and outside the U.S., and one interviewee stated that being fluent in that language makes them feel more connected to their culture as seen in EX. 1. However, the variation in answers slightly differed between those born in different countries and those born in the U.S. For those born outside the U.S., they stated that their fluency in the language was a way to connect them back home. For those born in the U.S., they stated that fluency in the language was influential in how connected to their culture/mother tongue.

EX. 1

Discussion and Conclusion

At the center of our research was an investigation into the factors that make up and influence linguistic identity. We ultimately align our definition of linguistic identity with a reading from our initial research (Dressler 2014, p. 43), which argues that “linguistic identity can be expressed in terms of expertise (i.e. linguistic competence), affiliation (formal or informal connections), or inheritance (familial connections).” None of these factors were considered to be mutually exclusive in our research. As previously exemplified, the linguistic identities of our participants were commonly observed to be in line with more than one of the pathways mentioned above. Most importantly, our research brought about more understanding of how people’s various reasons for their language fluency are intertwined largely with their understanding of culture and belonging. Language and communication with others are important to keeping cultures and traditions alive, it serves as a sense of cultural connection for most. With our findings, we discovered an insight into how language fluency, ideology, and culture intertwine with one another.

References

Dressler, R. (2015). Exploring Linguistic Identity in Young Multilingual Learners. TESL Canada Journal32 (1), 42. https://doi.org/10.18806/tesl.v32i1.1198

King, K. A. (2013). A Tale of Three Sisters: Language Ideologies, Identities, and Negotiations in a Bilingual, Transnational Family. International Multilingual Research Journal, 7(1), 49–65. https://doi.org/10.1080/19313152.2013.746800

Ted-Ed. (2015, June 23). The benefits of a bilingual brain – Mia Nacamulli [Video]. YouTube. https://www.youtube.com/watch?v=MMmOLN5zBLY

Zubrzycki, K. (2019). Am I perfect enough to be a true bilingual? Monolingual bias in the lay perception and self-perception of bi- and multilinguals . International Review of Applied Linguistics in Language Teaching, 57(4), 447-495. https://doi.org/10.1515/iral-2016-0095

 [/expander_maker]
, , , , , ,

Latecomers’ Usage of the [ɹ] Sound and Identity Construction

Bingbing Liu, Kejia Zhang, Nina Cai, Ze Ning, Zehao Yao

Recent sociolinguistic studies show interests in exploring people’s language practices and their corresponding social influences. In China, the rapid development of the society has attracted more and more people immigrating from the countryside to the city. Beijing, one of the most prosperous cities in China, welcomes immigrants coming from various cities. When different groups live together, their linguistic varieties actively interact with each other in a long run. This study focuses on the comparison between the insiders who were born and raised in Beijing and latecomers who settled down there in later times. Through observing their usages of [ɹ] sound, this study displays the pattern that latecomers might imitate the pronunciation of this sound and use it daily life, but they will not overcompensate it nor use in inappropriate contexts. Also, this study demonstrates that the acquisition of specific linguistic features is social-cultural affected, which is related to the speaker’s personalities, life experience, and preferences.

[expander_maker id=”1″ more=”Read more” less=”Read less”]

Introduction

China has witnessed a dramatic economic boost since the 1970s when the Reform and Opening-up Policy was promoted. Along with the acceleration of industrialization and urbanization, the social classes were changing due to massive internal immigration. Beijing, the most rigorous city in China, was the place where the capital, information, people, and culture were centralized. Numerous people swarmed into the city and settled there. These latecomers not only got used to the life there but also were influenced by local cultures. The use of the accent, the most frequently encounter in daily life, strongly influenced people’s perception of others and their own identities.

One of the most apparent features of the Beijing accent is the rhotacization of the [ɹ] sound, which usually occurs in syllable finals and is used as a diminutive suffix (Eckert 2018). It is often used to distinguish a local from an immigrant because it is hard to imitate and master. This study shows the latecomer’s acquisition and use of the [ɹ] sound in their daily life, and their understanding of the relation between the feature and identity construction. This paper includes several parts. A brief introduction and studies and research at home and abroad will be first presented. Then, the participants’ backgrounds and research methodology are introduced. After that, the data collection and interview recordings are displayed and analyzed. Finally, major findings are discussed in detail.

Literature Review

The rhotacization of [ɹ] sound was firstly studied phonetically because it works as a maker to distinguish a local in Beijing from a non-local. Many scholars have studied this phenomenon. According to Xu (2020), the morphosyntactic meanings of the [ɹ] sound is gradually diminishing, while it is used as a phonetic suffix attached at the end of words. Rather than focusing on the linguistic essence of the [ɹ] sound, other scholars pay attention to the socio-cultural influences of the Beijing accent. Zhang and Liu (2017) conducted a project on Northeast immigrants’ attitudes towards the Beijing accent. In their project, they found that female immigrants who tend to imitate [ɹ] sound are perceived as more educated, professional, and powerful the society, which helps to promote their social status. Besides, Liu (2018) observed that Chinese speakers in America with Chinese accents are more likely to welcome and accept each other because they are linked to national identities and a sense of belonging, which increases the interactions between immigrants. Dong and Blommaert (2009) have developed a theory, working on the relationship between space, scale, and accent. They suggest that the Beijing accent also catches immigrants’ attention since it symbolizes mandarin or the official language in China, which is beneficial for immigrants to interact with locals and assimilate into their cultures. Zhang (2005) studied the difference in language usage between the professionals in foreign companies and professionals in state-owned companies. She found that phonological variables of [ɹ] sound were not equally used in the market. Professionals in foreign companies frequently used [ɹ] sound to construct their identity as a new social class relating to consumerism, wealth, and citizenship, while their counterparts working in the state-owned companies prefer local accents. That obviously reflects the social stratification caused by various language usages.

However, limited studies focus on the latecomer’s usage of [ɹ] sound and how they used it to build their identities at the same time. This study aims at studying how this specific sound could be employed in linguistic capital and identity creation in Beijing, based on the research on the difference in the sound between insiders and latecomers, and the frequency and accuracy of using this sound. The hypothesis is that latecomers might overcompensate by using it more frequently than insiders, but not always correctly.

Methodology

The experimental approaches used in this study are to analyze the participants’ recordings and interviews. Participants are chosen using “a friend of a friend” since one of the group members is from Beijing. There are 24 people, aged 20 to 40, 12 males and 12 females, who were divided into two groups, insiders and latecomers respectively. Latecomers all have lived in Beijing for more than five years while insiders living here from birth. To make the experiment more general and accurate, other factors such as age and gender were excluded.

Two well-thought-out scripts were given to participants, one is a narrative paragraph and another is a tongue twister. The tongue twister contains a lot of [ɹ] sounds and is very intuitive to observe. However, having a tongue twister may not be enough because they may become defensive and consider adding or removing [ɹ] sounds. Thus, another narrating paragraph was added, which focuses on everyday conversation. From which we can see how they add or subtract [ɹ] sounds without being prepared. After all our observers have read the tongue twisters and narration paragraphs, the recording can then be analyzed to determine how many [ɹ] each person uses and where everyone is using [ɹ]. We try to find out if any interesting phenomena would occur, then investigate the causes of this linguistic behavior. Distributing and asking the participants to read the scripts without their prior knowledge of the research makes their speeches more natural, and that let us find interesting patterns of the locality of the [ɹ] sound.

The following video is an interview about Xiaotong Guan, a native speaker with authentic Beijing accent. The narrating paragraph chosen for our participants was extracted from the video, starting from 2:24 to 2:42. To better understand the Beijing accent and the [ɹ] sound, another video is provided which shows the clear distinction with and without the [ɹ] sound. 

Authentic Beijing Accent with the [ɹ] sound – Xiaotong Guan

Master the Beijing Accent with Chinese Stand-Up

Analysis

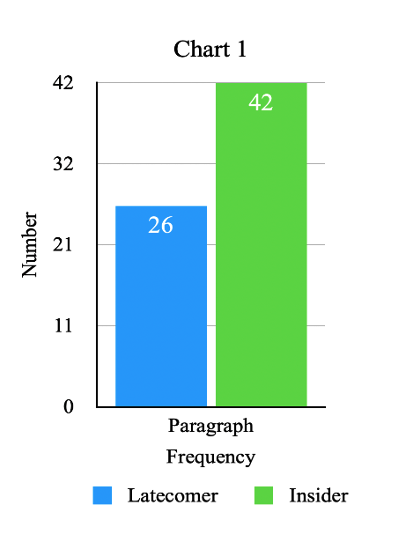
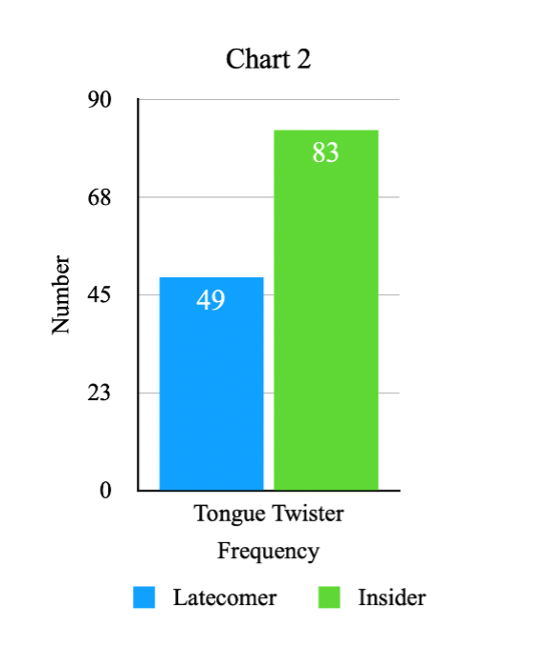
This study picked one script from our interview of the participant and wrote it in the Pinyin written system, and recordings of one of each participant’s pronunciations among the two groups. The data shows that insiders were adding more [ɹ] sounds than latecomers. Then, two charts show the result of the collected data. To show the differences in the data more visually, this study marked the areas of difference in red (refer to Appendix).

Chart 1: The Number of the Sound in Paragraph Showing the Different Frequency Between Latecomer and Insider
Chart 2: The Number of the Sound in Tongue Twist Showing the Different Frequency Between Latecomer and Insider

As the two tables above show, concerning the frequency of use of er sounds, in the case of interviews, latecomers used them 26 times however insiders used them 42 times. The percentage ratio is 62% to 100%. This means that insiders used the [ɹ] tone 100% of the time, while latecomers used the [ɹ] tone 62% of the time. In the case of tongue twister, latecomers used it 49 times, but insiders used it 83 times. The percentage ratio is 54% to 93%. The result indicates that in the “standard” case, the number of [ɹ] sound was used should have been 90 because two participants of the insiders did not add the [ɹ] sound where it should have been added, thus resulting in a non 100% value.

Based on this result, the researcher analyzed the data from a positional perspective, this study found two specific examples of the tongue twisters.

Example 1 一串串(means ‘Strings of..’)
Yi   chuan-er   chuan-er
Example 2 一段段(means ‘Paragraphs of..’)
Yi   Duan-er  Duan-er

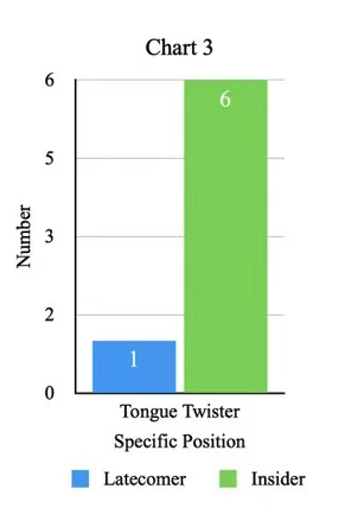
The data shows that two examples have the same pattern position of the [ɹ] sound insertion, i.e., insiders add both er sound to not only the penultimate but also the final word. However, most of the latecomers only add the [ɹ] sound to the final word. The specific data is that only one latecomer has the same insertion as the insiders whereas all 6 insiders add [ɹ] sound at both positions. The percentage ratio would be 17% to 100%, just like the data shows in Chart 3.

Chart 3: The Number of the Correct Position in Tongue Twister Added by Latecomer and Insider

Discussion and Conclusion

One of our major findings was that our previous assumptions were tested completely false by data analysis. We were expecting that latecomers use more [ɹ] sounds than insiders while talking about frequency. In addition, we were expecting latecomers would use the [ɹ] sound in incorrect positions. However, the result of the data showed the opposite.

The result from the data of our research appears to go against our hypothesis, which is that we think people who moved to Beijing in later times will employ “erhua” sounds more often, but not in the appropriate position. However, two of our (latecomer) participants stood out to us. The first participant was referred to P1. P1 employed the least of the [ɹ] sound among all of our participants from the two scripts we sent out. The second participant, P2, had employed the [ɹ] sound in an appropriate position and the frequency matched with locals. Due to the extreme differences shown in our data, we proceeded to interview them.

There are different linguistic findings from our interview for the two participants such as nature of personality, identity/language attitude, and linguistic capital. For P1, she is introverted. In the interview, she stated, “ I am more of an introvert, so I don’t like to socialize. I came here with a few friends from my town, and I usually only hang out with them.” A second finding from the interview for P1 is her identity/Language Attitude. The participant expressed that she does not believe in language prestige. Moreover, she is proud of her identity, so she doesn’t think adapting a Beijing accent is essential for her to live there.

Interestingly, our P2 participant expressed a different view on this matter. During the interview with P2, we found out about her attitude towards her Linguistic Capital. The participant believes that adapting a Beijing accent will help her in the future whether it’s for more job opportunities, networking, and better future, education, and an environment for her children. These findings connect with the Ted x Talks video on Youtube “Why your speaking style, like, says about you” by Vera Regan. The research tries to understand why people use the small word “like” in their casual speech. The results of the research communicate that language helps individuals to express their agency and choices. They let people freely identify with a country or a place, and they speak about people’s long-term plans. For P1, she identifies with her hometown and she is proud of her own identity. P2 identifies with Beijingese, thus, she adapts a Beijing accent to express that. She also has thought about her future in Beijing which comply with the long-term plans as in the research stated above.

For this research, since our target population focuses on the Beijing latecomers, studying their frequency of using the [ɹ] sound allows us to learn more about their social status including social identities, recognition, and self-identity construction. According to the main findings, we found that participants who used the [ɹ] sound more frequently are those people who tend to have a long-term plan to stay in Beijing and are willing to be socially reintegrated. In the process of research, we also encounter a few constraints due to the small number of participants which could cause limitations to the research results. First of all, there is actually no way of the “correct” Beijing accent since the geographical location and environment in which one lives will also affect the pronunciation of the [ɹ] sound. For example, people from the east side of Beijing may speak differently from those from the south side, Chongwen may speak slightly differently from Xuanwu, and even people from the same alley may have some minor differences in the use of [ɹ].  Therefore, we did not include an answer key for the “ɹ” sound in both the paragraph and the tongue twister. Instead, we could only take local Beijing participants’ pronunciation as the “standard” way and compare it with the latecomers to analysis amount of “ɹ” sound. The second limitation would be the sample volume. If we are only able to record and interview people in our social circle, the number is defined.

Among these local participants, most of them are the same age as us since we are still students with a fixed network, so classmates and friends while growing up are our first choice. The limited sample due to the lack of the diversity of age, occupation and other aspects caused our participants to not be representative enough. We assume that all latecomers would present similar data as we collected, but we ignore the fact that different social status and the stage of maturity would also possibly affect our hypothesis. Based on this limitation, our future research will pay more attention and develop our research on these social aspects to discover if there are any interesting patterns such as the differences of older people and new generation using [ɹ], as well as how people adopt the sound differently in various fields and positions. Moreover, we are passionate about learning the understanding of various demographic groups towards morphosyntactic functions of rhotacization as well as different expressions such as word choices for Beijing people specifically compared to people from other regions.


References

Dong, J. & Blommaert, J. (2009). Space, scale and accents: Constructing migrant identity in Beijing. Multilingua, 28(1), 1-23. https://doi.org/10.1515/mult.2009.001

Eckert, P. (2018). Meaning and linguistic variation: The third wave in sociolinguistics. Cambridge University Press.

Liu, K. F. (2018). Chinese Speakers in America: Diglossia as Style. essay: critical writing at Pomona College, 2(2), 5.

Xu, Z. (2020). Choosing rhotacization site in Beijing Mandarin: The role of perceptual similarity. University of California, Los Angeles.

Zhang, Q. (2005). A Chinese yuppie in Beijing: Phonological variation and the construction of a new professional identity. Language in society, 34(3), 431-466.

Zheng, M., & Liu, J. (2017, June). Language Attitude and Linguistic Practice of Northeastern Migrants in Beijing, China. In Proceedings of the 29th North American Conference on Chinese Linguistics (NACCL-29) (Vol. 2), Michigan State University.


Appendix 1

Paragraph


1

latecomer

/insider

2

latecomer

/insider


3

latecomer

/insider


4

latecomer

/insider


5

latecomer

/insider

6

latecomer

/insider

干活儿

ganhuo-er

1/1 1/1 1/1 -/1 1/1 -/1
官儿

guan-er

1/1 1/1 1/1 -/1 1/1 -/1
从小儿 congxiao-er 1/1 1/1 -/1 -/1 -/1 1/1
外套儿

waitao-er

1/1 1/1 1/1 -/1 1/1 1/1
这块儿 zhekuai-er 1/1 1/1 1/1 -/1 1/1 -/1
出门儿 chumen-er -/1 1/1 -/1 -/1 -/1 -/1
别这儿

biezhe-er

-/1 1/1 1/1 1/1 1/1 1/1
Tongue twister 1 latecomer

/insider

2 latecomer

/insider


3 latecomer

/insider


4 latecomer

/insider


5

latecomer

/insider

6

latecomer

/insider

哥俩儿

gelia-er

-/1 1/1 1/1 -/1 1/1 1/1
脸蛋儿

liandan-er

1/1 1/1 1/1 -/1 1/1 -/1
手拉手儿 shoulashou-er -/1 -/1 1/1 -/1 -/1 1/1
一块玩儿 yikuaiwan-er 1/1 1/1 1/1 -/1 1/1 1/1
一串串儿 yichuanchuan-er 1/1 1/1 1/1 -/1 1/1 1/1
一段段儿 yiduanduan-er 1/1 1/1 1/1 -/1 1/1 -/1
贪玩儿

tanwan-er

1/1 1/1 1/1 -/1 1/1 1/1
小猫儿 xiaomao-er 1/1 -/1 -/1 -/1 -/1 -/1
圆圈儿 yuanquan-er 1/1 1/1 1/1 -/1 -/1 1/1
小狗儿 xiaomao-er 1/1 1/1 1/1 -/1 -/1 -/1
庙台儿

miaotai-er

-/- -/1 1/1 -/1 1/- -/1
小鸡儿

xiaoji-er

-/- -/1 1/1 -/1 -/- 1/-
小米儿

xiaomi-er

-/- -/1 1/1 -/1 -/- 1/1
小鱼儿

xiaoyu-er

-/- -/1 1/1 -/1 1/1 1/1
水泡儿 shuipao-er 1/1 -/1 1/1 -/1 1/1 1/1


Tongue twister 1 latecomer

/insider

2 latecomer

/insider


3 latecomer

/insider


4 latecomer

/insider


5

latecomer

/insider

6

latecomer

/insider

一串串儿 yichuanchuan-er 1/1 1/1 1/1 -/1 1/1 1/1
一串儿串儿 yichuanchuan-er -/1 -/1 -/1 -/1 1/1 -/1
一段段儿 yiduanduan-er 1/1 1/1 1/1 -/1 1/1 -/1
一段儿段儿 yiduanduan-er -/1 -/1 -/1 -/1 1/1 -/1

[/expander_maker]

, , , ,

How We SEE Sign: The Interplay Between Sign Styles and Characteristics of Deaf Identity

Serena Gutridge, Ally Shirman, Jennifer Miyaki, Paige Escobar, Paulina Cuevas

Are the variations in sign language attributed to just a flick of the wrist? This study provides an analysis of the relationship between agents’ identities within the Deaf community and their signing style. In the United States, signers use American Sign Language (ASL) and Signed Exact English (SEE) on a continuum. These variants differ on a number of different levels concerning syntax (sentence structure), lexicon (words), and morphology (word parts with meaning). We investigated the relationship between different sociocultural factors (e.g. age, education, family) and a signer’s use of the linguistic features from these two variants (think: different choices of words or signs!) across various conversation topics related to identity. Our results suggest a correlation between using ASL features and the discussion of more personal topics, particularly those related to identity. On the other hand, SEE features were more prominent when discussing more mundane topics (e.g. errands, opinions on cars).

[expander_maker id=”1″ more=”Read more” less=”Read less”]

Big D ‘Deaf’ versus little d ‘deaf’

The Deaf (or, deaf) identity is not confined into one category. There are two distinctions often made when referring to the Deaf/deaf identity: big D ‘Deaf’ vs little d ‘deaf’.

Big D ‘Deaf’ refers to the cultural aspect of being Deaf. Those who refer to themselves as “Big D Deaf” tend to have stronger Deaf identities and participate more actively in the Deaf community. Big D Deaf people are also often people who went to Deaf schools or who were raised in Deaf households.

In contrast, “little d deaf” refers specifically to the medical condition of deafness and people who identify themselves in this way typically have a less strong Deaf identity (Lucas, 1989). They are also more often than not, people who are postlingually deaf. Postlingual deafness is deafness that occurs after the acquisition of language, so typically after the age of 6.

One of the most interesting differences between these two is their signing. People who refer to themselves as “Big D Deaf” tend to sign more on the ASL side of the spectrum, while those who refer to themselves as “little d deaf” tend to be more on the SEE side of the spectrum. But what exactly is ASL and SEE, and how are they different?

 ASL versus SEE

Like spoken languages, signed language has variations that are identified as somewhat different languages: American Sign Language (ASL) and Signed Exact English (SEE). Most people are aware of the existence of ASL because it is the standard form of sign language in the United States, but SEE is another, more informal style of sign language that is more similar to the typical expectation of how sign language works. It’s important to note that SEE is not a language in itself, but a variety of sign language modeled around English syntax (Power et al.,, 2008). ASL is its own language that has different grammatical structures than English and does not necessarily have exact equivalent signs for English vocabulary. SEE, on the other hand, is a literal translation of English into signs that uses the same linear grammatical structure as English.

There are two different typical constructions for simple sentences like “I am going on vacation tomorrow” in ASL as you can see in Table 1 below. Additionally, interrogative words (do, who, what, when…) appear at the end of sentences and are often used in rhetorical questions in place of using “because” (I went to the store why? I needed eggs).

Table 1: Examples of simple ASL grammatical constructions

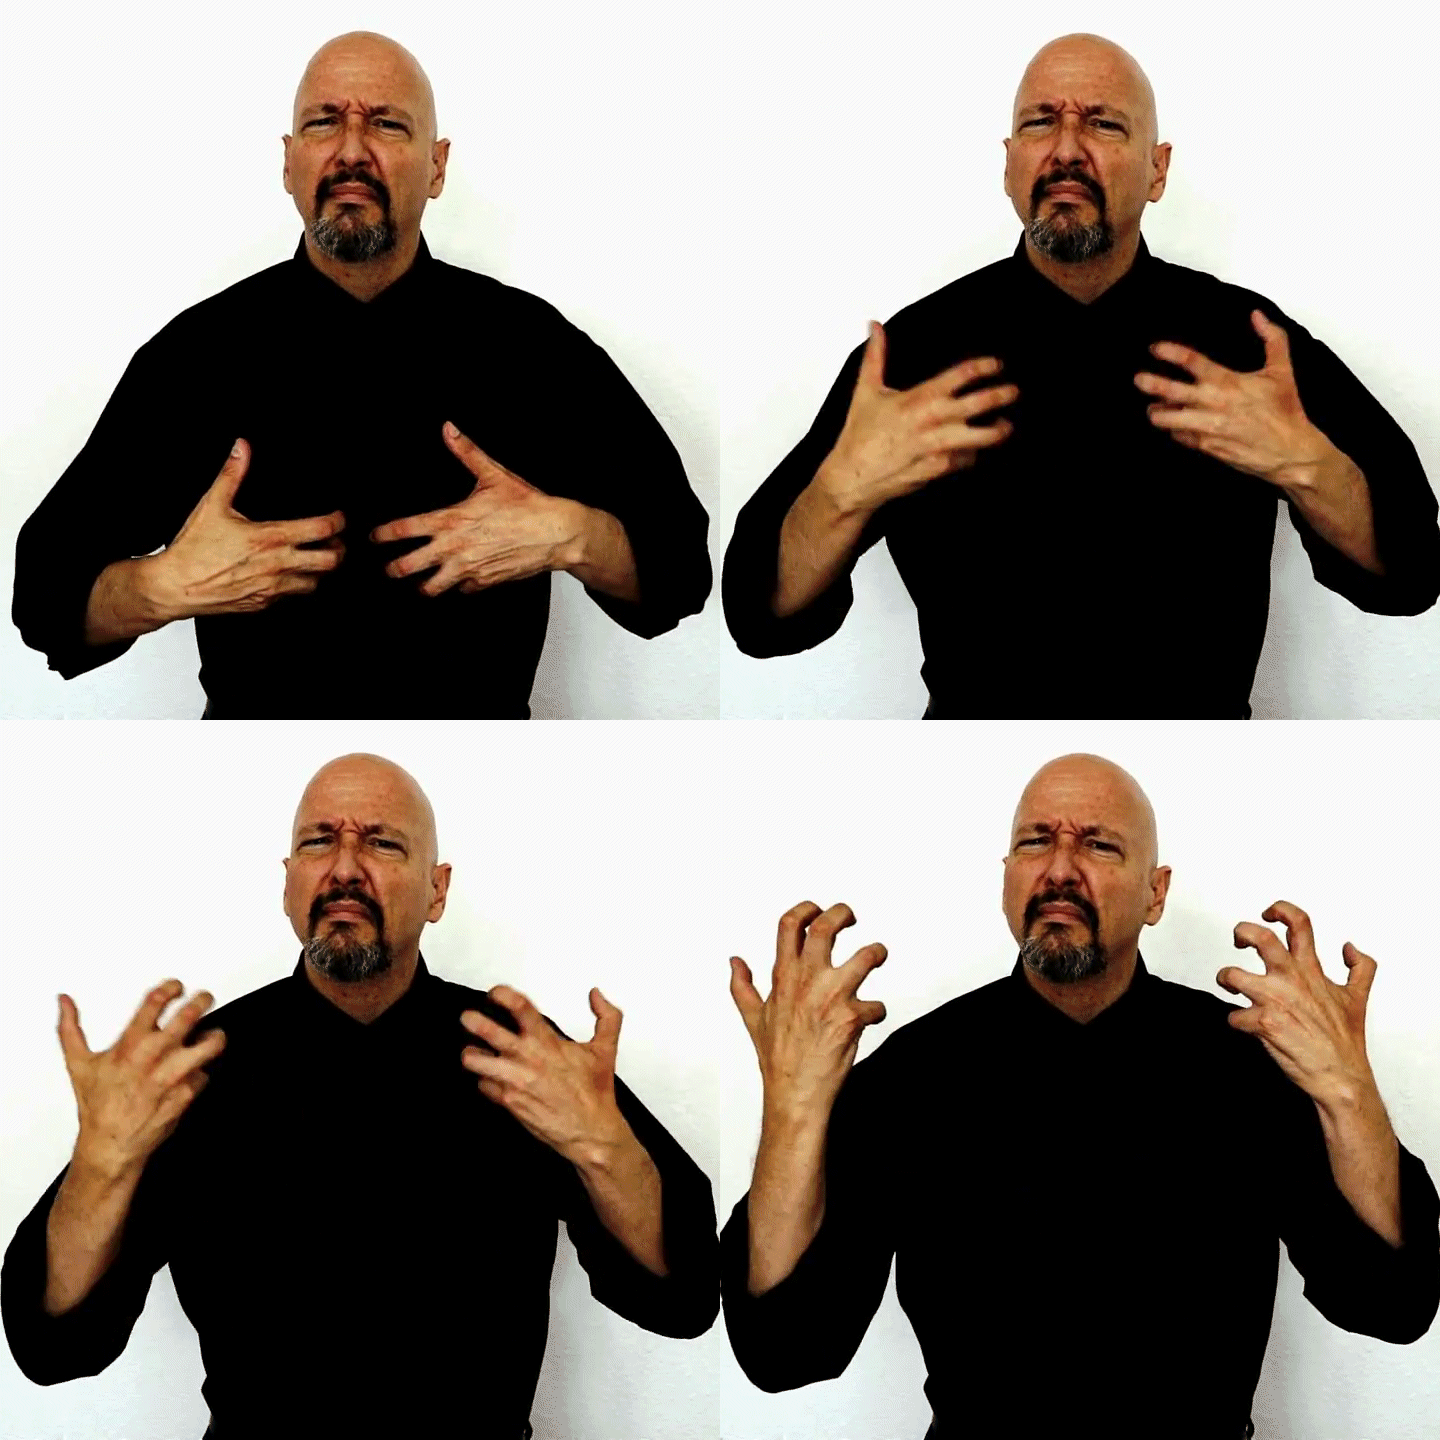
ASL is not a liner language meaning that the signs are not the only elements that are used to communicate meaning. Mouth morphemes are movements made with the mouth that convey information or add grammatical information to signs. Non-manual markers are elements of communication that aren’t hand signs, such as facial expressions, body positions (like a signer’s shoulders shifting to the left or right during signing) and head position. Mouth morphemes and non-manual markers are essential for communicating temporal aspect, distance/length, emotions, distinguishing between different signs, and various adjectives/adverbs (Valli & Lucas, 2000). You can find an example of facial expressions used as non-manual markers in Figure 1 below.

Figure 1: The sign for “angry”
The sign for “happy” (Vicars)


On the other hand, SEE sign follows the English linear word order and uses connectors (and, because), prepositions (e.g. on, in, to, when, during, of), and articles (fingerspelling “the,” “a/an”). Because of the linear order of SEE, mouth morphemes and non-manual markers are unnecessary since the concepts they communicate are expressed with their own signs in the linear word order exactly like in English (Valli & Lucas, 2000). The following video by ASL THAT is a great example of the difference between ASL and SEE.

ASL vs. SEE Comparison | ASL – American Sign Language

ASL typically employs a “show not tell” style of communication meaning that signs often look like what they mean. This non-arbitrary connection between the sign and its meaning is similar to onomatopoeias in spoken language like “boom,” “crash” and “meow.” These iconic signs are crucial for ASL and are exemplified by signs known as iconic classifiers such as the one shown in Figure 2. Classifiers are used to show the events or actions being explained instead of explaining them using other signs in the way that we tell stories in English(Valli & Lucas, 2000) (Vicars). Think of ASL as a picture that shows something and English as the caption that explains that something.

Figure 2: A signer using the iconic classifier for “person” to explain that a person is walking (Vicars)

These types of signs are not so necessary for SEE because of literal signs. SEE will often use literal signs as if the signer was literally translating English into signs. So, people will sign “online” as “on line” using the signs for “on” and “line” but will not often use iconic classifiers.

Background

Signing style is a spectrum, meaning that no signer will sign purely ASL or purely SEE and many signers use a pidgin style of sign which combines elements of the two. There are many different aspects of life that contribute to an individual’s signing style and overall Deaf identity, including education and access to Deaf education, family, and social connections to the Deaf community.

Education is a large part of the development of an individual’s Deaf identity – such as if they were mainstreamed or if they went to an oral Deaf school. Being “mainstreamed” refers to a deaf child who goes to a non-deaf school, where an oral Deaf school is a school for the Deaf that emphasizes the use of spoken language. Often oral Deaf schools do not engage in the use of sign language at all, which can greatly influence the signing style of the individual, as well as their identity within the Deaf community (Nikolaraizi, 2006).

In addition, if the person either grew up in a Deaf or signing household can influence not only their signing style but also the development of their Deaf identity. But whether their family utilizes sign language is not the only influence family can play on an individual’s Deaf identity and signing style. Much like how school teachers and peers’ views on deafness can influence an individual, how the person’s family views their deafness can also have the same amount of influence. If people around them have a negative view of deafness then that can cause the individual to also view their own deafness as a negative.

But lastly, if the individual regularly attends Deaf events or has friends who are either Deaf themselves or who can sign can also heavily influence their Deaf identity. With all these factors influencing the development of a person’s signing style and Deaf identity it’s no wonder that not each individual views their deafness the same way. But this raises the question of whether these two factors, signing style and Deaf identity, are interrelated in any way.

The big question

Since ASL is the mainstreamed language of the Deaf community and SEE sign is the less prestigious variety, does the spectrum of sign language used by an individual directly correlate to educational background and/or a sense of identity with the Deaf community?

Methods

To answer this question, five participants were recruited through UCLA’s ASL club (Hands On) and through personal connections of the authors. The ideal participant was someone fluent in sign language, but not limited to someone who exclusively uses only ASL or only SEE. Highlighting the spectrum of SEE to ASL use is important for understanding how usage of the variations correlates with Deaf identity, so a diverse group of participants was key. For reference later on, note that the individual participants are nicknamed as colors (Aqua, Violet, Blue, Cyan, Maroon) for privacy.

Each participant filled out a survey for demographics (age, gender, and if they’re a UCLA student) and background information related to signing. Participants described their hearing capabilities; Other questions asked about language acquisition (when the participant learned to sign), family context (if family members are deaf/Deaf and sign with the participant), language use with others, as well as education history (mainstreamed, Deaf school, tutoring, etc). 

Once background information was collected, participants either submitted a recording of themselves or participated in a Zoom meeting answering a variety of questions. Note that three participants answered the prompts alone, while the remaining two participants (Cyan and Maroon) partook in this portion of the study together.

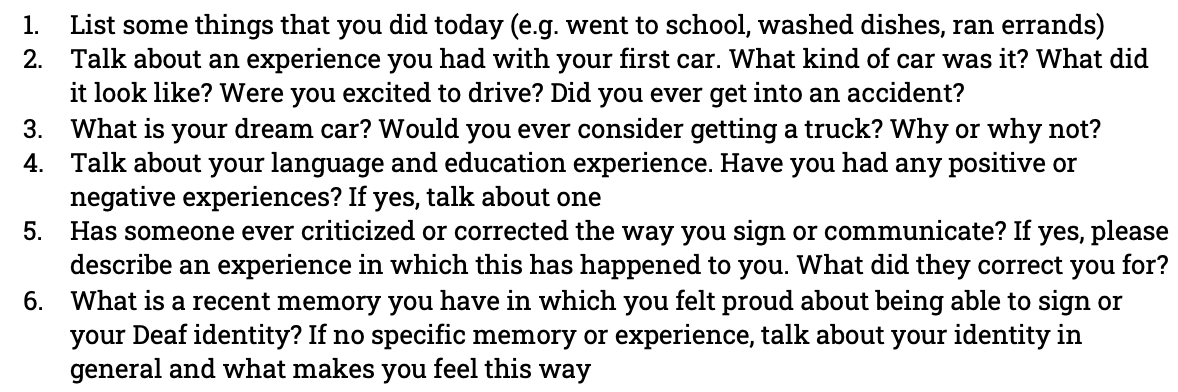
The interviews were conducted to later analyze the participants’ use of SEE and ASL – how much they used each variety and in which contexts. Listed below are the questions asked, in the order they were given to the participants:

  1. List some things that you did today (e.g. went to school, washed dishes, ran errands)
  2. Talk about an experience you had with your first car. What kind of car was it? What did it look like? Were you excited to drive? Did you ever get into an accident?
  3. What is your dream car? Would you ever consider getting a truck? Why or why not?
  4. Talk about your language and education experience. Have you had any positive or negative experiences? If yes, talk about one
  5. Has someone ever criticized or corrected the way you sign or communicate? If yes, please describe an experience in which this has happened to you. What did they correct you for?
  6. What is a recent memory you have in which you felt proud about being able to sign or your Deaf identity? If no specific memory or experience, talk about your identity in general and what makes you feel this way

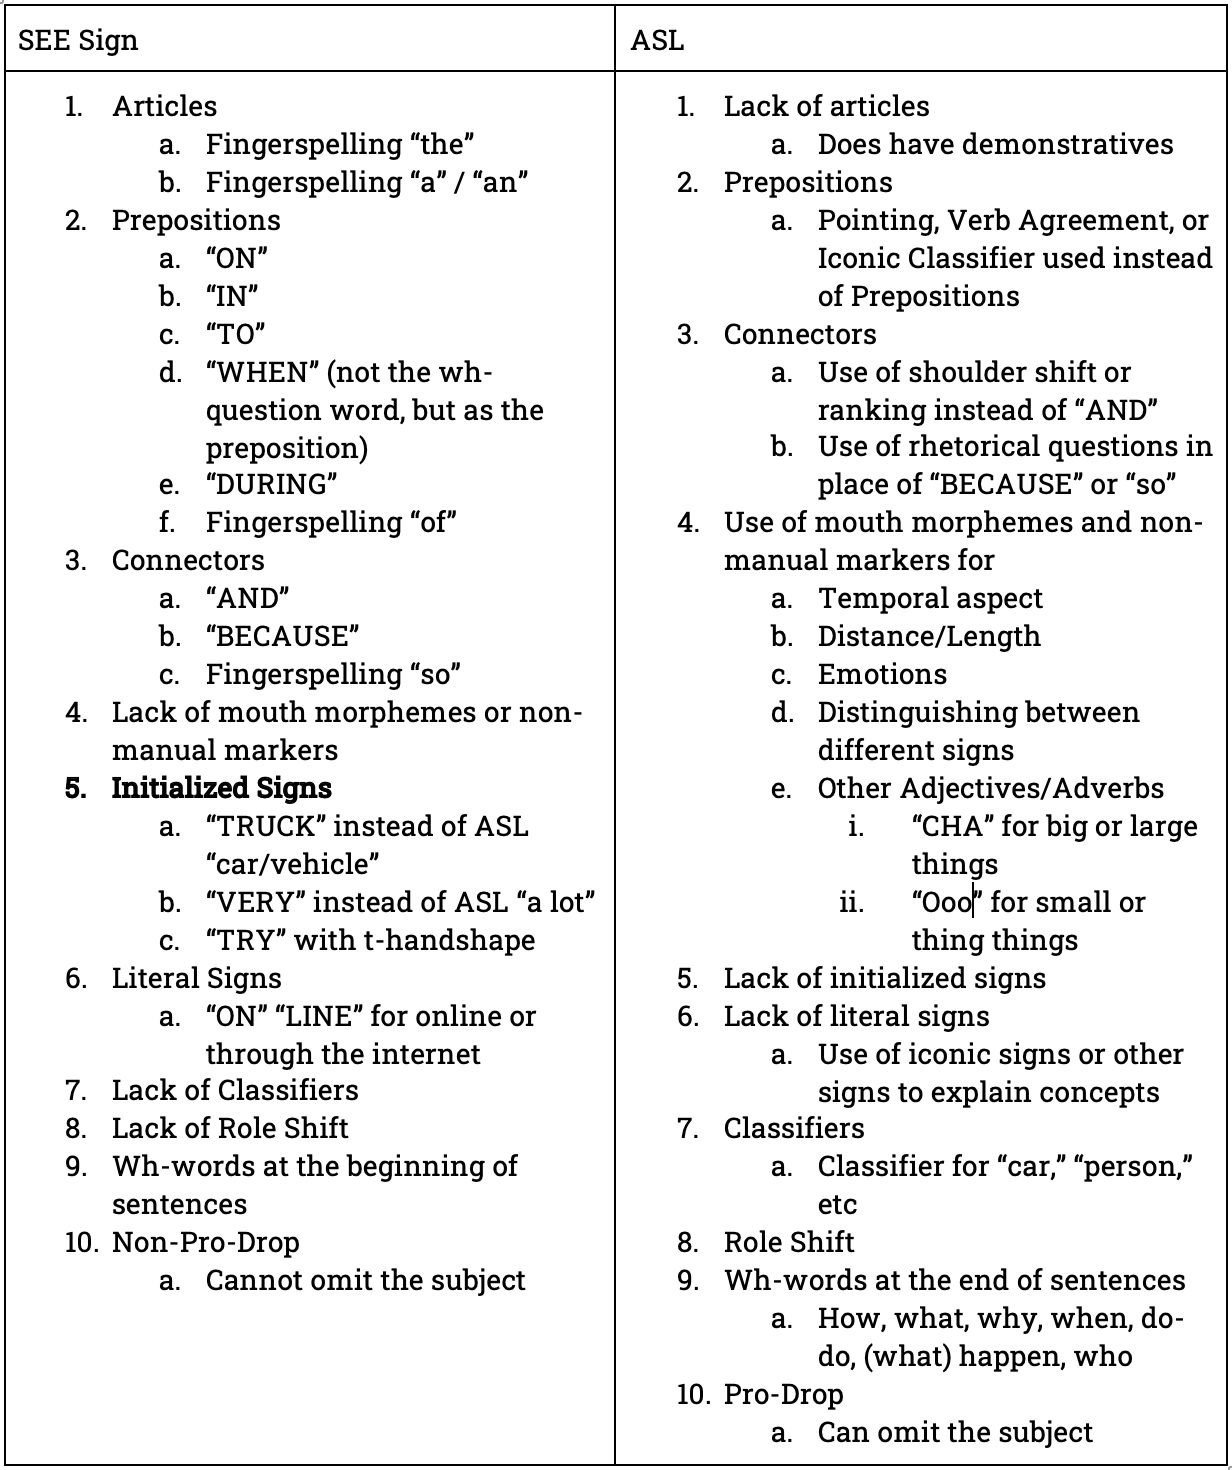
Throughout the interview, general markers of both ASL and SEE were tallied for all participants, shown in Table 2 below. Participants were only communicated with through text to ensure that participants’ varieties weren’t influenced by the type of signing from the experimenters when giving instructions.

Table 2: The main differences of SEE (left column) and ASL (right column), listed

The questions were designed to trigger specific ASL or SEE marked signs. For example, Q1 prompted list making, which differs between ASL (finger ranking and shoulder shift) and SEE (using “AND” and absence of ranking and shoulder shift); Q3 asks about trucks to observe if participants would initialize the sign for “car,” (see Figure 3) holding both hands in fists and pretending to be steering, with the letter “T” to denote “truck,” or use “car/vehicle” for both cars and trucks as done in ASL.

Figure 3: the sign for “car” or more generally, “vehicle,” in ASL (Vicars)

Data Collection

Over 80 minutes of footage of the participants signing their responses to the questions was reviewed, transcribed, and coded. See Figure 4 for an excerpt of a transcript we did.

Figure 4: Excerpt of a transcript

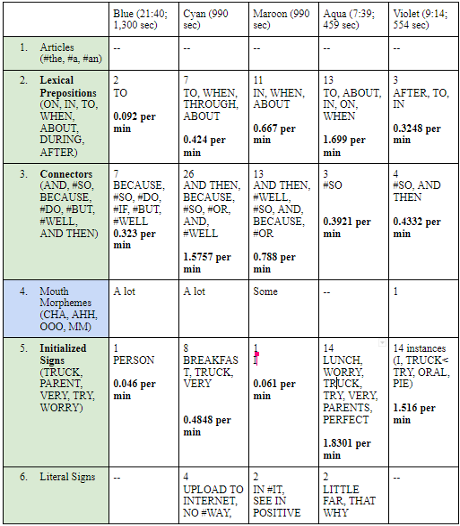
Their answers were interpreted by the researcher fluent in ASL and then translated into English. After interpreting the conversations, each feature was made note of in our charts. The charts were organized by each participant’s answers and then condensed into a larger (“mother”) chart with data from all participants. See Figure 5a for a chart done for an individual participant, and Figure 5b for an excerpt of the “mother chart.” SEE features were counted and tallied, while the frequency of ASL features were qualitatively described, since the SEE features being looked for were specific lexical items and thus, easier to count.

Figure 5a: Individual participant chart
Figure 5b: Excerpt of “mother” chart

Analysis

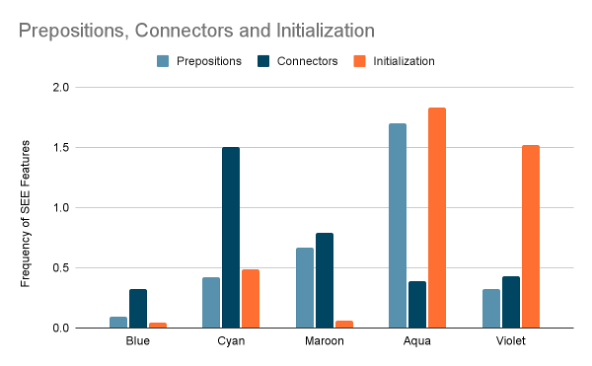
When sorted based on different categories of SEE features (e.g. prepositions vs. connectors vs. initializations), signers each had their own individual frequency of each linguistic category. Some signers utilized numerous initialized signs, but had low frequencies for connectors and prepositions. See Violet in Figure 6. Others had low frequencies for prepositions and initializations, but a high frequency for connectors. See Cyan in Figure 6. It is important to note that high instances of a certain feature were often repetition of the same sign and can be attributed to signing style, which would explain why the data is exaggerated for certain features in some signers. For instance, Cyan had high levels of ASL features (e.g. role shift, mouth morphemes) and low levels of SEE prepositions and initializations. However, she had a high use and repetition of the same connectors (e.g. fingerspelled “so”).

Figure 6: Frequency of SEE features based on category vs. participants

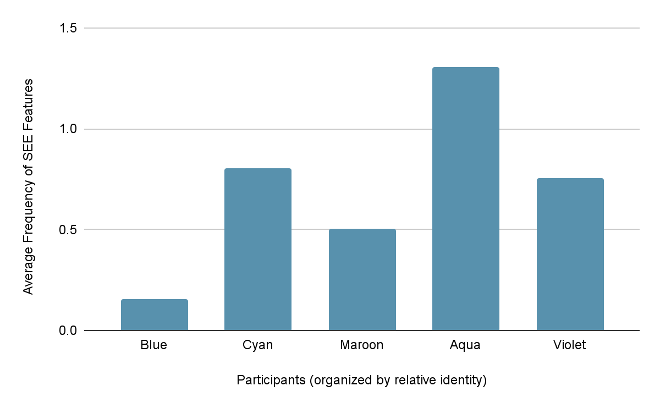
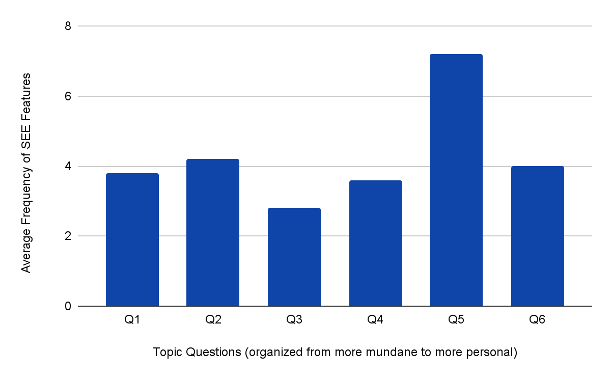
In addition, signers’ use of SEE features correlated with key factors related to Deaf identity, such as educational background, age, and family. In Figure 6 and Figure 7, participants are organized from left to right based on a subjective organization of these key factors.

Through this, we are able to make note of significant differences in the signers. Although both Blue and Violet identify with the Deaf community, educational factors contribute to their Deaf identity. In fact, Violet initialized signs 32.956 (3,295.6%) times more per minute than Blue. Violet, our oldest participant, attended an oral deaf school in her youth and was prohibited from signing in the classroom and encouraged to only speak and read lips. Blue, out of all our signers has the highest level of education in regard to ASL, having attended Gallaudet University for a master’s degree, where ASL and English are both the language of instruction. Gallaudet University is the only liberal arts Deaf university in the world. The CODA (Child of Deaf Adult) of the group, Aqua, has the lowest level of formal ASL education, but is a native signer in which their parents are both Deaf. See Figure 7 for an average frequency of SEE features for each participant. Keep in mind that Cyan’s frequency of SEE features may not be a completely accurate representation of where she falls on the ASL-SEE sign continuum, since she had a high frequency of connectors due to repetition of the same lexical items. In addition, Cyan had the second highest frequency of other ASL features, such as role-shift and mouth morphemes.

Figure 7: Average frequency of SEE features for each participant; participants organized based on relative key factors corresponding to Deaf identity

Not only was there a correlation between frequency of SEE features and relative Deaf identity, but the type of conversation topic was also a factor that influenced the frequency. See Figure 5 for average frequency across conversation topics. More mundane topics (e.g. Questions 1/2/3) had a higher degree of SEE features with the exception of Question 5. Question 5 triggered an unexpected stark increase in the frequency of SEE features as participants detailed past experiences of being criticized for their signing. This high frequency may be due to participants slipping into the variant that they were criticized for (in this case, signing more SEE over ASL). For some participants (e.g. Aqua and Violet), Question 3 did not trigger enough of a response due to lack of interest in the topic (dream car), therefore rendering a lower frequency of SEE features than expected. Considering ASL features in conjunction to the data presented in Figure 8, we witness that the topics that were more personal (Questions 4/5/6) have a lower frequency of SEE with respect to the more mundane topics, with exception to question 5 as aforementioned.

Figure 8: Average frequency of SEE features across conversation topics

Additionally, note that the two signers, who leaned more on the SEE side of the continuum, tended to correct themselves while signing. A signer would begin an initialized sign then quickly amend their sign to the ASL variety. This may have happened because they were aware of their SEE signing feature as less prestigious to ASL and made the correction as a form of meta-linguistic awareness.

Limitations & Future Research

Exemplified data does not take into consideration ASL features which would show more personal topics have less SEE features in comparison. Since the data is unable to reflect the instances of ASL features because they are not as easily countable as the lexical features of SEE, there is a low visual significance with respect to topic and sign preference.

Discussion

Though this research focuses on a very small sample size, this research is an example of how language can index identity and whether a speaker or signer chooses to use one linguistic feature over another can range depending on social context, the topic at hand, and the interlocutor. Our results suggest that certain topics can trigger different responses in which signers may shift or choose a particular identity or set of linguistic features from their linguistic repertoires they would like to showcase in that given situation. More mundane topics may trigger different linguistic features than more personal ones, especially when a particular variety has less prestige over another in a given community (in this case, the Deaf and signing community). The correlation between signing style and Deaf identity found in this study aligns with the more researched theory that language variety can index an agent’s identity and is replicable in many other sociolinguistic areas.


References

Gallaudet University – What you do here changes the world! (2021, November 15). Gallaudet University. https://www.gallaudet.edu/

Lucas, C. (1989), The Sociolinguistics of the Deaf Community. Academic Press, Inc.

Lucas, C., Valli, C., & Bayley, R. (2001). Sociolinguistic Variation in American Sign Language (1st ed.). Gallaudet University Press.

Nikolaraizi, M. (2006). The role of educational experiences in the development of deaf identity. Journal of Deaf Studies and Deaf Education, 11(4), 477–492. https://doi.org/10.1093/deafed/enl003

Power, D., Hyde, M., & Leigh, G. (2008). Learning English From Signed English: An Impossible Task? American Annals of the Deaf, 153(1), 37–47. http://www.jstor.org/stable/26234486

Stremlau, T. (2003). Language Policy, Culture, and Disability: ASL and English Rhetoric Review, 2003, Vol 22, No. 2, 184-190.

Valli, C., & Lucas, C. (2000). Linguistics of American Sign Language Text, 3rd Edition: An Introduction (3rd ed.). Gallaudet University Press.

Vicars, W. (n.d.). ASL University. Retrieved from https://www.lifeprint.com/asl101/lessons/lessons.htm

[/expander_maker]

, , , , ,
Scroll to Top